Case–Shiller index
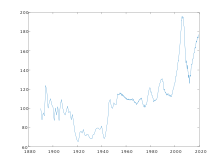
They are based on original work by economists Karl Case and Robert Shiller, whose team calculated the home price index back to 1890.
Shiller claims in his book Irrational Exuberance that such a long series of home prices does not appear to have been published for any country.
While Case argued that such a boom was ultimately unsustainable, he had not considered it a bubble, a commonly used term to describe similar market trends.
[3] Case sat down with Shiller, who was researching behavioral finance and economic bubbles, and together formed a repeat-sales index using home sales prices data from other cities across the country.
The FinTech giant Fiserv bought Case Shiller Weiss in 2002 and, together with Standard & Poor's, developed tradable indices based on the data for the markets which are now commonly called the Case-Shiller index.
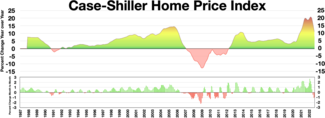
[4] The years 2006–2012 saw the largest crash in global real estate markets in recent history; whether this could have been predicted using the Case–Shiller index is up for dispute.
However, he refrains from explicitly stating that this may be a bubble, after all the period after World War II had seen a substantial rise in real prices without any subsequent drop as apparent in the chart.
Shiller draws some key insights from his analysis of long term home prices in his book Irrational Exuberance.
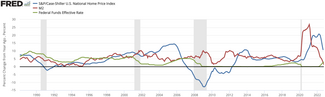
Moreover, he illustrates how the pattern of changes in home prices bears no relation to changes in construction costs, interest rates or population.
[6] Shiller notes that there is a strong perception across the globe that home prices are continuously increasing, and that this kind of sentiment and paradigm may be fueling bubbles in real estate markets.
[9] Shiller's key observation, as outlined in his book Irrational Exuberance, is that real home prices show a remarkable tendency to return to their 1890 level.
[12] REIT's track commercial real estate most closely, rather than home prices, explaining the low correlation.
According to Shiller, one of the main purposes of futures and options trading in the Case-Shiller indices is to allow people to hedge the real estate market.
[14] The problem, however, is that the volume of trading in these markets is small enough as to make them relatively illiquid which creates a risk for the investor in these securities.