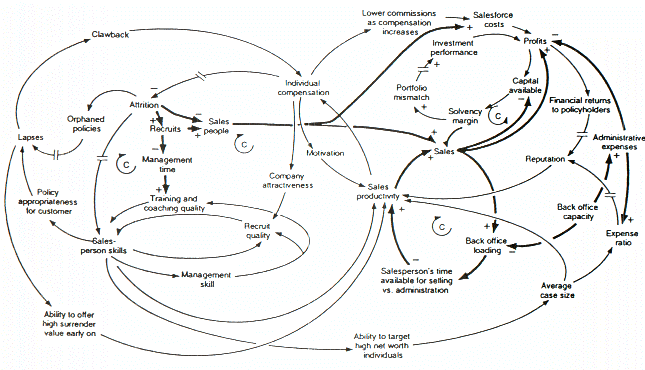
Causal loop diagram
As with the links, feedback loops have either positive (i.e., reinforcing) or negative (i.e., balancing) polarity.
CLDs contain labels for these processes, often using numbering (e.g., B1 for the first balancing loop being described in a narrative, B2 for the second one, etc.
), and phrases that describe the function of the loop (i.e., "haste makes waste").
Example of positive reinforcing loop shown in the illustration: The use of words and arrows (known in network theory as nodes and edges) to construct directed graph models of cause and effect dates back, at least, to the use of path analysis by Sewall Wright in 1918.
According to George Richardson's book "Feedback Thought in Social Science and Systems Theory",[2] the first published, formal use of a causal loop diagram to describe a feedback system was Magoroh Maruyama's 1963 article "The Second Cybernetics: Deviation-Amplifying Mutual Causal Processes".