Chirp spectrum
This frequency-domain representation is an alternative to the more familiar time-domain waveform, and the two versions are mathematically related by the Fourier transform.
In the special case where s(t) is constrained to be an up-chirp, flat topped pulse with its instantaneous frequency varying as a linear function of time, then an analytical solution is possible.
, then the expressions for the Fresnel arguments become The spectra are now functions of the product T.ΔF, independent of any particular values of center frequency and bandwidth.
In addition, a number of mathematical software programs, such as Mathcad, MATLAB and Mathematica have built-in routines to evaluate the integrals, either as standard functions or in extension packages.
When the product is small, the Fresnel ripples are very much in evidence, but the spectrum does tend to a more rectangular profile for larger values.
In the case of the plots of residual phase, Φ2(ω), the profiles tend to be very similar over a wide range of time-bandwidth products.
As expected, the group delay is a linear function with a duration T secs, over a frequency sweep of ΔΩ rads.
[6]: 34 [8][9][10] The method relies on the fact that the major contributions to the Fourier integral come from the region where the rate of change of phase is minimal, i.e. when
Unless θ(t) is a constant, the point in time ts at which the phase is stationary will vary according to the instantaneous frequency ωs.
The particular usefulness of the stationary phase method lies in its ability to provide results when the frequency sweep is non linear.
In such cases the spectral response can be shaped to meet some desired design criteria, for example, low side-lobes when a chirp is compressed.
It is possible to find the group delay characteristics of these functions in a similar manner to that carried out above and the results for n = 1 to 4 have been calculated.
[6]: 51 Although these cosine functions are amenable to mathematical manipulation, they are rarely chosen to define the spectral characteristics of a chirp, in practice, because when compressed they give broad main pulses with high side-lobe levels.
Now because the principle of stationary phase shows that there is a direct relationship between elapsed time and the instantaneous signal delay then, for the Hamming window, t/T can be related to ω/ωmax by
Other spectral shapes can be investigated in the same way and the results, although approximate, are surprisingly accurate, especially when the time bandwidth product of the pulse is high.
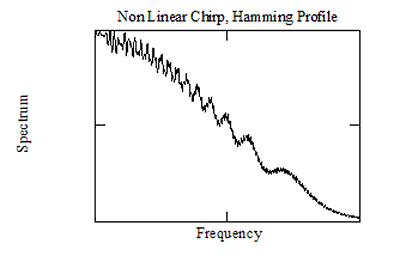
The figure shows that the spectral profile matches the Hamming characteristic quite well, but Fresnell ripples, not predicted by the method, are very much in evidence.
Whenever a Fourier integral cannot be evaluated by analytical means, an approximate solution is usually possible by numerical analysis.
[13]: 114 [14]: 34 If the time interval between samples is W, then sn = s(nW), and the desired integral is obtained, approximately, by summing the rectangular areas.
The baseband portion of the spectrum is shown in more detail in the next figure and the response shows a distinct slope, being significantly lower at the higher frequencies.
Although the characteristic of the zero order hold has a small influence on this result, the slope is mainly due to the properties of the chirp.
(A linear chirp, on the other hand, has a nominally flat spectrum because its frequencies are swept at the same rate, as shown in some earlier plots).
If we limit interest in the output spectrum to a finite number of discrete data points (= N), at frequencies ωm given by
The FFT process assumes the waveform is cyclic, so these 128 data points can be considered to be part of an endlessly repeating sequence in time.
There is very little spectral content beyond the sweep frequency range of a chirp pulse and this is especially true for waveforms where the time-bandwidth product is large.
The actual profiles of these rise and fall regions of a pulse do not seem to be critical and may be provided, for example, by band limiting filters in analogue implementations and a linear slope in digital ones.
This method uses an inverse Fourier transform in order to derive a waveform which has a spectrum with the phase characteristic of a chosen chirp but a new amplitude profile which is rectangular and ripple free.
The chirp waveform resulting from this process has a very long time duration, but when it is truncated to say, a length 2T, then the spectrum acquires some ripple once more, as shown.
Often, to improve the characteristics of the pulse and lower the sidelobe levels, its spectrum is modified, typically to a bell-shaped profile.
In the case of an antenna array, similar profiling by "weighting functions" is used to reduce the spatial sidelobes of the radiation pattern.
By means of the stationary phase method described earlier, an approximate relationship between time and frequency can be obtained: