Coal mining in the United States
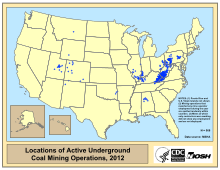
[4] According to the U.S. Energy Information Administration (EIA), in 2015, Wyoming, West Virginia, Kentucky, Illinois, and Pennsylvania produced about 639 million short tons (580 million metric tons), representing 71% of total coal production in the United States.
[12][13][14] On May 10, 2019, the third largest U.S. coal company by production, Cloud Peak Energy, filed for Chapter 11 bankruptcy protection.
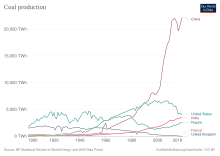
[16] Coal, primarily from underground mines east of the Mississippi was the nation's primary fuel source until the early 1950s.
Like the Keystone Pipeline the building of the terminals raised environmental concerns with respect to global warming.
[59] Most of the decrease in coal electricity was offset by an increase in generation from natural gas-fired power plants.
[66] As of 2013, domestic coal consumption for power production was being displaced by natural gas, but production from strip mines utilizing thick deposits in the western United States such as the Powder River Basin in northern Wyoming and Southern Montana for export to Asia increased.
The federal coal program is overseen by the Bureau of Land Management (BLM) under the US Department of Interior.
Federal coal lands are leased by competitive sealed bids, for the highest bonus (initial payment) offered.
In addition, the government receives an annual rental of $3 per acre, and a fixed percentage royalty of the market value of coal produced.
[70] In 2014, the program generated about $1.2 billion in lease bonuses, rentals, and royalties for coal mining on federal lands.
[72] The Government Accountability Office has questioned whether bonus and royalty rates reflect coal's market value.
BLM personnel noted that the coal mined in Utah was closer to its market, and so was more valuable due to lower transportation cost.
[70]: 44 The GAO also noted that the competitiveness of federal coal lease sales was limited by lack of multiple bids.
[70]: 16–19 A Boston-based think tank, the Institute for Energy Economic & Financial Analysis study estimated that, since 1991, $29 billion over a 30-year period was lost in the Powder River Basin, due to lack of competitive bidding.
The energy value of mined US coal hit its all-time peak a decade earlier, in 1998, at 26.2 quadrillion BTU.
[45] The most fatalities during the 2005–2014 decade were 48 in 2010, the year of the Upper Big Branch Mine disaster in West Virginia, which killed 29 miners.
[83] When mountaintop removal mining is used, not only do the miners suffer, but people living in the regions develop health issues.
Excess rock, also known as overburden, removed from the mountains is dumped into valleys creating toxic runoff, that often pollutes streams used for local water sources or even the groundwater and wells.
In addition to the respiratory and cardiac illnesses that remain a threat to coal miners, these individuals are also at risk for mental health related issues.
On top of that, it was also found that individuals who were closely involved or located near mountaintop removal sites were more at risk for higher mortality rates, developing life-threatening diseases, and total poverty than those who extracted coal underground.
[85] Critics of coal mining in West Virginia sometimes refer to the mine locations as energy sacrifice zones,[86] being loosely defined as areas where the health of the people and the environment has been sacrificed for the energy, jobs and profits that can be derived from the activity.
Perdue and Pavela blamed this on the fact that "dependency on natural resources resulted in stifled development and negative socioeconomic outcomes."
[85] Concern about global warming in the US[87] – especially in the aftermath of Hurricane Katrina and Al Gore's receipt of the 2007 Nobel Peace Prize for his raising awareness of climate change – temporarily increased public opposition to new coal-fired power plants.