Compact letter display
[1] As well as marking distinguishability in this way, CLD also ranks variables, or factors, by their respective mean (or average) in descending order.
Given the structure of the Roman alphabet, the CLD methodology could readily compare up to 26 different variables, or factors.
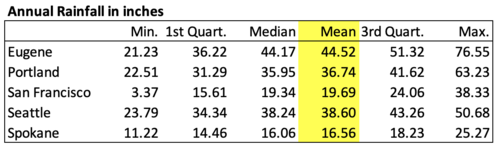
As shown above, the rainfall data for the five West Coast cities is sorted in alphabetical order.
Next, we reproduce the same table but we sort the cities using the CLD methodology after we would have conducted a Tukey's range test.
They are both classified "c." But, Eugene's mean rainfall level is statistically different and higher than either Seattle & Portland or San Francisco & Spokane.
And, Seattle & Portland have mean rainfall levels that are statistically different and higher than San Francisco & Spokane.
Additionally, San Francisco & Spokane also have similar rainfall means as they are both identified with the "c" letter.
In the absence of the CLD methodology, the main underlying way of identifying statistical difference in means between paired variables is the mentioned Tukey's range test.
The Tukey's range test uncovered that San Francisco & Spokane did not have statistically different rainfall mean (at the alpha = 0.05 level) with a p-value of 0.08.
As shown earlier, it is a lot easier to convey the differentiation between cities rainfall mean using the CLD methodology.