Bar chart
Diagrams of the velocity of a constantly accelerating object against time published in The Latitude of Forms (attributed to Jacobus de Sancto Martino or, perhaps, to Nicole Oresme)[2] about 300 years before can be interpreted as "proto bar charts".
For example, a business owner with two stores might make a grouped bar chart with different colored bars to represent each store: the horizontal axis would show the months of the year and the vertical axis would show revenue.
This may, for instance, take the form of uniform height bars charting a time series with internal stacked colours indicating the percentage participation of a sub-type of data.
Stacked bar charts are not suited to data sets having both positive and negative values.
Generally: Roles of the vertical and horizontal axes may be reversed, depending on the desired application.

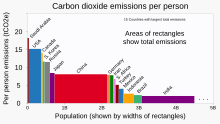
* countries' respective populations (along x axis),
* per-person CO2 emissions 1990-2018 (along y axis), and
* total emissions for that country (rectangle area = product
x*y
of sides' lengths)