Congenital red–green color blindness
[1] It is caused by variation in the functionality of the red and/or green opsin proteins, which are the photosensitive pigment in the cone cells of the retina, which mediate color vision.
The prefix indicates the cone (photopsin) that is affected, with lexemes from Greek, "first" (prot-) or "second" (deuter-) referring to the L- and M-opsins respectively.
Anomalous trichromacy is also trichromatic, but the spectral sensitivity of at least one of the cone cells is altered, leading to a gamut that is a different size or shape.
[citation needed] The starkest difference is the scoterythrous effect, where reds appear dimmer to protans.
The protan luminous efficiency function is narrower at long wavelengths, which causes the reds to be darker.
[citation needed] The two are difficult to differentiate with color vision tests, but is most reliably performed with an Anomaloscope.
This device measures the proportion of red and green light that must be mixed to perceptually match a yellow reference.
[citation needed] The mechanism of congenital red–green color blindness relates to the functionality of cone cells, specifically to the expression of photopsins, the photopigments that 'catch' photons and thereby convert light into chemical signals.
[8] These 7 functionally dimorphic sites will tune the opsin to a higher (redshift) or lower (blueshift) wavelength.
In other words, the most common alleles of each gene that contribute to normal color vision are as far apart as they can be in the spectrum (about 30 nm) without novel point mutations.
[citation needed] During meiosis, homologous recombination between chromosomes of the same type may occur where they exchange a portion of their genes.
The exchanged portions are generally equivalent (have the same genes) and this process is called equal homologous recombination.
[6] Unequal homologous recombination occurs when the exchanged portions of the chromosomes are not equal, i.e. they don't break in the same spot.
This is in contrast to acquired color blindness that is not present at birth and may be caused by aging, accidents, medication, etc.
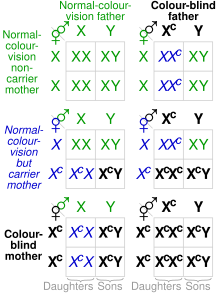
Some conclusions from the table include:[citation needed] The Punnett square and this section assume each chromosome only has one affected gene.
The exact phenotype of some of the combinations depend on whether the affected gene represents an anomalous allele or is missing.
[15] One such woman has been widely reported to be a true or functional tetrachromat, as she can discriminate colors most other people can't.
Management of the condition through the use of color blind glasses to alleviate symptoms or smartphone apps to aid with daily tasks is possible.
[19] The lower prevalence in females is related to the x-linked inheritance of congenital red–green color blindness, as explained above.
Interestingly, even Dalton's very first paper already arrived upon this 8% number:[20] ...it is remarkable that, out of 25 pupils I once had, to whom I explained this subject, 2 were found to agree with me...Other ethnicities will generally have a lower prevalence of congenital red–green color blindness.