Error threshold (evolution)
In evolutionary biology and population genetics, the error threshold (or critical mutation rate) is a limit on the number of base pairs a self-replicating molecule may have before mutation will destroy the information in subsequent generations of the molecule.
The error threshold is crucial to understanding "Eigen's paradox".
During the replication process, each digit has a certain probability of being replaced by some other digit, which changes the way the molecule interacts with its environment, and may increase or decrease its fitness, or ability to reproduce, in that environment.
If a molecule exceeds this critical size, the effect of the mutations becomes overwhelming and a runaway mutation process will destroy the information in subsequent generations of the molecule.
The error threshold is also controlled by the "fitness landscape" for the molecules.
The fitness landscape is characterized by the two concepts of height (=fitness) and distance (=number of mutations).
Also, it was noted by Wilke (Wilke 2005) that the error threshold concept does not apply in portions of the landscape where there are lethal mutations, in which the induced mutation yields zero fitness and prohibits the molecule from reproducing.
Eigen's paradox is one of the most intractable puzzles in the study of the origins of life.
It is thought that the error threshold concept described above limits the size of self replicating molecules to perhaps a few hundred digits, yet almost all life on earth requires much longer molecules to encode their genetic information.
This problem is handled in living cells by enzymes that repair mutations, allowing the encoding molecules to reach sizes on the order of millions of base pairs.
A number of solutions to this paradox have been proposed: Consider a 3-digit molecule [A,B,C] where A, B, and C can take on the values 0 and 1.
Let's ignore double mutations and the death of molecules (the population will grow infinitely), and divide the eight molecules into three classes depending on their Hamming distance from the master sequence: Note that the number of sequences for distance d is just the binomial coefficient
where the matrix 'w’ that incorporates natural selection and mutation, according to quasispecies model, is given by: where
The eigenvectors of the w matrix will yield the equilibrium population numbers for each class.
If we have a replication fidelity of Q=0.95 and genetic advantage of a=1.05, then the equilibrium concentrations will be roughly
If we have a replication fidelity of Q approaching 0, then the equilibrium concentrations will be roughly
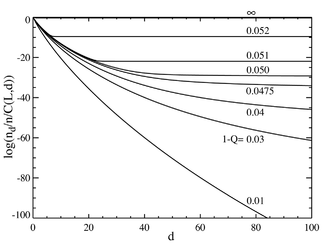
If we now go to the case where the number of base pairs is large, say L=100, we obtain behavior that resembles a phase transition.
The plot below on the left shows a series of equilibrium concentrations divided by the binomial coefficient
(This multiplication will show the population for an individual sequence at that distance, and will yield a flat line for an equal distribution.)
It is seen that for low values of the total mutation rate, the population consists of a quasispecies gathered in the neighborhood of the master sequence.
Above a total mutation rate of about 1-Q=0.05, the distribution quickly spreads out to populate all sequences equally.
The plot below on the right shows the fractional population of the master sequence as a function of the total mutation rate.
For mutation rates above this value, the population of the master sequence drops to practically zero.
In the limit as L approaches infinity, the system does in fact have a phase transition at a critical value of Q:
For faithful replication to occur, the information must be "frozen" into the genome.