Dashboard (computing)
The dashboard is often accessible by a web browser and is typically linked to regularly updating data sources.
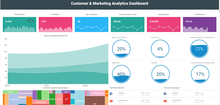
[1][3] Dashboards are often interactive and facilitate users to explore the data themselves, usually by clicking into elements to view more detailed information.
Early predecessors of the modern business dashboard were first developed in the 1980s in the form of Executive Information Systems (EISs).
Due to problems primarily with data refreshing and handling, it was soon realized that the approach wasn't practical as information was often incomplete, unreliable, and spread across too many disparate sources.
[5] Thus, EISs hibernated until the 1990s when the information age quickened pace and data warehousing, and online analytical processing (OLAP) allowed dashboards to function adequately.
[5] Despite the availability of enabling technologies, the dashboard use didn't become popular until later in that decade, with the rise of key performance indicators (KPIs), and the introduction of Robert S. Kaplan and David P. Norton's balanced scorecard.
Benefits of using digital dashboards include:[9] Ability to make more informed decisions based on collected business intelligence Dashboards offers a holistic view of the entire business as it gives the manager a bird's eye view into the performance of sales, data inventory, web traffic, social media analytics and other associated data that is visually presented on a single dashboard.
Lastly, dashboards offer for better customer service through monitoring because they keep both the managers and the clients updated on the project progress through automated emails and notifications.
[5] Dashboards are the 3rd step on the information ladder, demonstrating the conversion of data to increasingly valuable insights.
Strategic dashboards benefit from static snapshots of data (daily, weekly, monthly, and quarterly) that are not constantly changing from one moment to the next.
Dashboards for analytical purposes often include more context, comparisons, and history, along with subtler performance evaluators.
In addition, analytical dashboards typically support interactions with the data, such as drilling down into the underlying details.
An example of the latter is web-based-browser Asana, which helps teams orchestrate their work, from daily tasks to strategic cross-functional initiatives.
With it, teams can manage everything from company objectives to digital transformation to product launches and marketing campaigns.
Digital dashboard projects involve business units as the driver and the information technology department as the enabler.
However, although both visually display critical information, the difference is in the format: Scorecards can open the quality of an operation while dashboards provide calculated direction.
It should always contain these components: Each of these sections ensures that a Balanced Scorecard is essentially connected to the businesses critical strategic needs.
For example, GE Aviation has developed a proprietary software/portal called "Digital Cockpit" to monitor the trends in the aircraft spare parts business.
[15] A research-based framework for Business Intelligence dashboard design suggests that "cross-visual interactivity" is the most impactful of all features.
Power BI provides the tools for a user to create different types of visualizations to communicate the data that they are using.
Power BI also has a commonly used map feature where businesses can view their sales and earnings across different states and countries.
Power BI is also interactive in that in any type of map a person can expand a specific category to look deeper into the data contained.
For example, if one were to analyze revenues across the United States you could set a parameter to only show salaries within a particular range.
[21] Arena Calibrate provides a comprehensive business intelligence reporting tool, accompanied by hands-on data & BI support.
Their offerings cater to startups, agencies, and SMEs, empowering them to fully leverage Advertising, Sales, Email, CRM, Web, and Analytics data.
Being able to have a visual reporting system allows multiple processing operations to be carried out and that could increase the effectiveness of decisions.