Demand curve
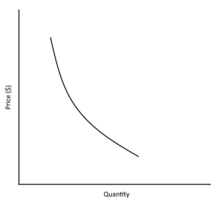
It is generally assumed that demand curves slope down, as shown in the adjacent image.
Demand curves are used to estimate behaviour in competitive markets and are often combined with supply curves to find the equilibrium price (the price at which sellers together are willing to sell the same amount as buyers together are willing to buy, also known as market clearing price) and the equilibrium quantity (the amount of that good or service that will be produced and bought without surplus/excess supply or shortage/excess demand) of that market.
Shift of the demand curve as a whole occurs when a factor other than price causes the price curve itself to translate along the x-axis; this may be associated with an advertising campaign or perceived change in the quality of the good.
[4] The usual method is to collect data on past prices, quantities, and variables such as consumer income and product quality that affect demand and apply statistical methods, variants on multiple regression.
The issue with this approach, as outlined by Baumol, is that only one point on a demand curve can ever be observed at a specific time.
The standard form of the demand equation can be converted to the inverse equation by solving for P: The demand is called convex (with respect to the origin[7]) if the (generally down-sloping) curve bends upwards, concave otherwise.
Demand curve are, however, considered to be generally convex in accordance with diminishing marginal utility.
[11] Non-price determinants of demand are those things that will cause demand to change even if prices remain the same—in other words, the things whose changes might cause a consumer to buy more or less of a good even if the good's own price remained unchanged.
[12] Some of the more important factors are the prices of related goods (both substitutes and complements), income, population, and expectations.
However, demand is the willingness and ability of a consumer to purchase a good under the prevailing circumstances; so, any circumstance that affects the consumer's willingness or ability to buy the good or service in question can be a non-price determinant of demand.
High elasticity indicates that consumers will respond to a price rise by buying much less of the good.
There does exist a family of demand curves with constant elasticity for all prices.
If the price axis in the graph represents the price before addition of tax and/or subtraction of subsidy then the demand curve moves inward when a tax is introduced, and outward when a subsidy is introduced.
In order to construct a derived demand curve, specific assumptions must be made and values held constant.