Law of demand
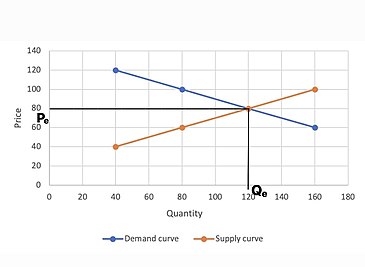
Economist Alfred Marshall provided the graphical illustration of the law of demand.
[2] This graphical illustration is still used today to define and explain a variety of other concepts and theories in economics.
They also help us identify opportunities to buy what are perceived to be underpriced (or sell overpriced) goods or assets.
[7] Law of Demand is relied heavily upon by managerial economics, which is a branch of economics that applies microeconomic analysis to managerial decision-making, to make informed decisions on pricing, production, and marketing strategies.
In this context, understanding the alternative factors that influence the Law of Demand becomes crucial for managers and decision-makers.
The exceptions to the law of demand typically suit the Giffen commodities and Veblen goods which is further explained below.
[3] The famous law of demand was first stated by Charles Davenant (1656-1714) in his essay, "Probable Methods of Making People Gainers in the Balance of Trade (1699)".
[9] However, there were instances of its understanding and use much earlier when Gregory King (1648-1712) made a demonstration of the law of demand.
Skipping forward to 1890, economist Alfred Marshall documented the graphical illustration of the law of demand.
[2] In Principles of Economics (1890), Alfred Marshall reconciled the demand and supply into a single analytical framework.
This idea of demand and supply curve is what we still use today to develop the market equilibrium and to support a variety of other economic theories and concepts.
Due to general agreement with the observation, economists have come to accept the validity of the law under most situations.
Economist also see Alfred Marshall as the pioneer of the standard demand and supply diagrams and their use in economic analysis including welfare applications and consumer surplus.
[1] Changes in the demand curve are usually caused by 5 major factors, namely: number of buyers, consumer income, tastes or preferences, price of related goods and future expectations.
[12] On the other hand, lower mortgage rate leads to a higher willingness to buy at all prices, and eventually shifting the demand curve to the right.
The metric figure produced by the equation thus determines the strength of both the relationship and competition between the two goods.
The Income elasticity of demand effectively represents a consumers idea as to whether a good is a luxury or a necessity.
However, this measurement is also subject to the availability of substitutes, consumer behaviours and price points of the good being advertised.
As an example, during the Great Famine of Ireland of the 19th century, potatoes were considered a Giffen good.
Potatoes were the largest staple in the Irish diet, so as the price rose it had a large impact on income.
People responded by cutting out on luxury goods such as meat and vegetables, and instead bought more potatoes.
This can be illustrated with the Slutsky equation for a change in a good's own price: The first term on the right-hand side is the substitution effect, which is always negative.
For inferior goods, this is negative, so subtracting this means adding its positive absolute value.
[6] Similarly, if the household expects the price of the commodity to decrease, it may postpone its purchases.
Examples of Veblen goods are mostly luxurious items such as diamond, gold, precious stones, world-famous paintings, antiques etc.
[6] Veblen goods appear to go against the law of demand because of their exclusivity appeal, in the sense that if a price of a luxurious and expensive product is increased, it may attract the status-conscious group more, since it will be further out of reach for an average consumer.
Thorstein Veblen referred to this sort of consumption as the purchase of goods that do not exhibit additional utility or functionality but offer status and reveal socioeconomic position.
[22] In simple words, these goods are not bought for their satisfaction but for their "snob appeal" or "ostentation".
[22] Accordingly, all these factors also lead to an upward sloping demand curve for Veblen goods along a certain price range.
Their analysis of the demand for paintings by masters and for other objects proves Veblen by relying heavily on the allocative role of prices in markets with social interactions.