Demographics of Birmingham
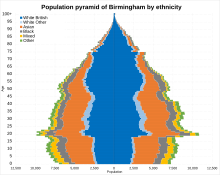
Sutton Coldfield district had the highest proportion of people aged 60 years and over.
Hodge Hill was found to have the highest population of people from the age of 0 to 15 whilst the districts of Edgbaston and Sutton Coldfield had the lowest.
[7] The district of Ladywood had the highest percentage of males in its population at 49.7%, whilst Northfield had the lowest at 47.45%.
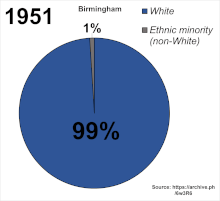
[14] The following table shows the ethnic group of respondents in estimations for 1951, 1961, 1966, 1971, 1981 and in the 1991 to 2021 censuses in Birmingham.
[25] The next largest entries of the "Black" ethnicity group, after Nigerian (5,764), were Eritrean (3,020), Other/unspecified (2,467), Somalilander (2,261) and Ghanaian (2,229).
[25] The most common main languages spoken in Birmingham according to the 2011 census are shown below.
[37] It's worth bearing in mind that according to another study that references 2011 census data, Polish becomes the second most popular language, behind Punjabi, within the West Midlands Region, of which Birmingham is the largest constituent.
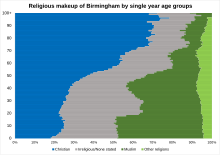
[40] There were only 21 out of 354 local authorities in England where the proportion of self-described Christians was lower than that of Birmingham.
Birmingham's total Muslim population of 140,033 was the highest of any local authority area.
[39] The majority of people classifying themselves in one of the White or Black ethnic groups said that they were Christian.
At the same time, 29.6% (1,840) Black Africans and 10.8% (1,581) people from the White 'Other' ethnic group said they were Muslim.
51.7% of Birmingham's Hindu population lived in six wards of the city; Handsworth Wood (2,461), Springfield Sparkhill, Sparkrbook, Small Heath, Alum Rock, Ward End, Saltley, Bordesley Green, Washwood Heath, Stechford (2,023), Lozells and East Handsworth (1,761), Soho (1,699), Hall Green (1,224) and Sparkbrook (845).
71.7% of Birmingham's Muslim population lived in seven wards of Birmingham; Sparkbrook, Sparkhill, Small Heath, Alum Rock, Ward End, Saltley, (19,372), Bordesley Green (18,629), Washwood Heath, Stechford, (16,847), Springfield (13,461), Aston (12,381), Lozells and East Handsworth (10,853) Nechells and Bromford (8,822), all inner-city wards.
The majority of Sikhs were found to live in the west and south east of the city.
[39] The following table shows the religion of respondents in estimations for 1991 and in the 2001, 2011 and 2021 censuses in Birmingham.
[citation needed] The following table shows the accommodation type of all usual residents in households in Birmingham (2021 census).