Demographics of England
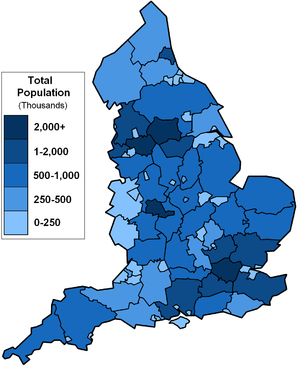
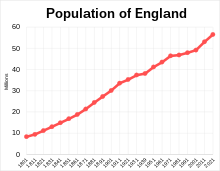
The demography of England has since 1801 been measured by the decennial national census, and is marked by centuries of population growth and urbanization.
Due to the lack of authoritative contemporary sources, estimates of the population of England for dates prior to the first census in 1801 vary considerably.
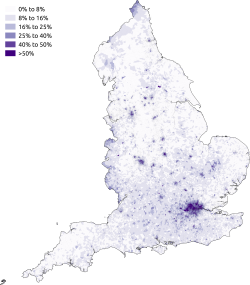
In 2023, the percentage of live births where either one or both parents were born outside of the UK was 38.2 per cent.
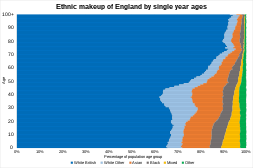
[28] 85.4% 7.8% 3.5% 2.3% 1.0% 100% Notes for table above The ethnicity of school pupils in England has been changing since the figures started to be collected in 2002, White British students proportionally have been in decline compared to other groups who have risen.
The most common main languages spoken in England according to the 2011 census are shown below.