Duverger's law
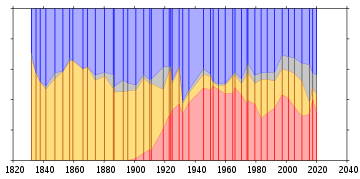
[10] Loosely united on a platform of country-wide economic reform and federally funded industrialization, the decentralized Whig leadership failed to take a decisive stance on the slavery issue, effectively splitting the party along the Mason–Dixon line.
Southern rural planters, initially attracted by the prospect of federal infrastructure and schools, aligned with the pro-slavery Democrats, while urban laborers and professionals in the northern states, threatened by the sudden shift in political and economic power and losing faith in the failing Whig candidates, flocked to the increasingly vocal anti-slavery Republican Party.
[7] William Clark and Matt Golder (2006) find the effect largely holds up, noting that different methods of analyzing the data might lead to different conclusions.
[16] Thomas R. Palfrey argued Duverger's law can be proven mathematically at the limit when the number of voters approaches infinity for one single-winner district and where the probability distribution of votes is known (perfect information).
[17] Duverger did not regard this principle as absolute, suggesting instead that plurality would act to delay the emergence of new political forces and would accelerate the elimination of weakening ones, whereas proportional representation would have the opposite effect.
[2][10] In Matt Golder's 2016 review of the empirical evidence to-date, he concluded that despite some contradicting cases, the law remains a valid generalization.
[18] Steven R. Reed argued in 2001 that Duverger's law could be observed in Italy, with 80% of electoral districts gradually but significantly shifting towards two major parties.
[19] He finds a similar effect in Japan through a slow trial-and-error process that shifted the number of major parties towards the expected outcome.
[20] Eric Dickson and Kenneth Scheve argued in 2007 that Duverger's law is strongest when a society is homogenous or closely divided, but is weakened when multiple intermediate identities exist.