Electrocardiography
Electrocardiography is the process of producing an electrocardiogram (ECG or EKG[a]), a recording of the heart's electrical activity through repeated cardiac cycles.
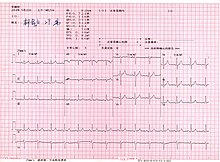
The overall magnitude of the heart's electrical potential is then measured from twelve different angles ("leads") and is recorded over a period of time (usually ten seconds).
To the trained clinician, an ECG conveys a large amount of information about the structure of the heart and the function of its electrical conduction system.
Medical uses for this information are varied and often need to be combined with knowledge of the structure of the heart and physical examination signs to be interpreted.
However, persons employed in certain critical occupations, such as aircraft pilots,[23] may be required to have an ECG as part of their routine health evaluations.
Hypertrophic cardiomyopathy screening may also be considered in adolescents as part of a sports physical out of concern for sudden cardiac death.
Many ECG machines are now portable and commonly include a screen, keyboard, and printer on a small wheeled cart.
Recent advancements in electrocardiography include developing even smaller devices for inclusion in fitness trackers and smart watches.
[38] The common virtual electrode, known as Wilson's central terminal (VW), is produced by averaging the measurements from the electrodes RA, LA, and LL to give an average potential of the body: In a 12-lead ECG, all leads except the limb leads are assumed to be unipolar (aVR, aVL, aVF, V1, V2, V3, V4, V5, and V6).
[39] Because voltage is by definition a bipolar measurement between two points, describing an electrocardiographic lead as "unipolar" makes little sense electrically and should be avoided.
[44] Older versions of the nodes (VR, VL, VF) use Wilson's central terminal as the negative pole, but the amplitude is too small for the thick lines of old ECG machines.
The Goldberger terminals scale up (augments) the Wilson results by 50%, at the cost of sacrificing physical correctness by not having the same negative pole for all three.
The Lewis lead or S5-lead (requiring an electrode at the right sternal border in the second intercostal space) can be used to better detect atrial activity in relation to that of the ventricles.
[47] An esophageal lead can be inserted to a part of the esophagus where the distance to the posterior wall of the left atrium is only approximately 5–6 mm (remaining constant in people of different age and weight).
The heartrate range of between 60 and 100 beats per minute (bpm) is considered normal since data shows this to be the usual resting heart rate.
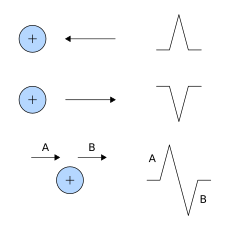
The theory is rooted in electromagnetics and boils down to the four following points:[55] Thus, the overall direction of depolarization and repolarization produces positive or negative deflection on each lead's trace.
Atrial repolarization is typically hidden in the much more prominent QRS complex and normally cannot be seen without additional, specialized electrodes.
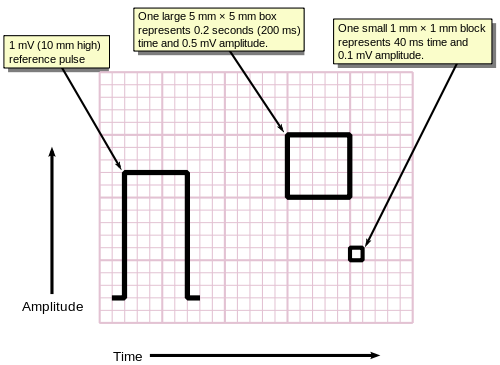
For example, determining if the tracing is a sinus rhythm only requires feature recognition and matching, and not measurement of amplitudes or times (i.e., the scale of the grids are irrelevant).
[58] The QRS axis is the general direction of the ventricular depolarization wavefront (or mean electrical vector) in the frontal plane.
Population data shows that a normal QRS axis is from −30° to 105°, with 0° being along lead I and positive being inferior and negative being superior (best understood graphically as the hexaxial reference system).
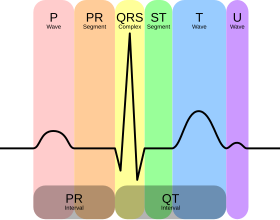
All of the waves on an ECG tracing and the intervals between them have a predictable time duration, a range of acceptable amplitudes (voltages), and a typical morphology.
The animation shown to the right illustrates how the path of electrical conduction gives rise to the ECG waves in the limb leads.
During frame 7, the depolarization is traveling through the largest amount of tissue in the atria, which creates the highest point in the P wave.
This causes the depolarization of the interventricular septum tissue to spread from left to right, as depicted by the red arrow in frame 14.
Frames 18–21 then depict the depolarization as it travels throughout both ventricles from the apex of the heart, following the action potential in the Purkinje fibers.
ST elevation myocardial infarctions (STEMIs) have different characteristic ECG findings based on the amount of time elapsed since the MI first occurred.
[75] Artifacts are distorted signals caused by a secondary internal or external sources, such as muscle movement or interference from an electrical device.
[76][77] Distortion poses significant challenges to healthcare providers,[76] who employ various techniques[78] and strategies to safely recognize[79] these false signals.
[82][83] Whitbread, consultant nurse and paramedic, suggests ten rules of the normal ECG, deviation from which is likely to indicate pathology.
For example, an observation of peaked T waves is not sufficient to diagnose hyperkalemia; such a diagnosis should be verified by measuring the blood potassium level.