Earned value management
Early EVM research showed that the areas of planning and control are significantly impacted by its use; and similarly, using the methodology improves both scope definition as well as the analysis of overall project performance.
[1] More recent research studies have shown that the principles of EVM are positive predictors of project success.
The genesis of EVM occurred in industrial manufacturing at the turn of the 20th century, based largely on the principle of "earned time" popularized by Frank and Lillian Gilbreth.
In the most recent edition of the PMBOK guide, EVM is listed among the general tools and techniques for processes to control project costs.
In the 1970s and early 1980s, a subculture of C/SCSC analysis grew, but the technique was often ignored or even actively resisted by project managers in both government and industry.
In 1991, Secretary of Defense Dick Cheney canceled the Navy A-12 Avenger II Program because of performance problems detected by EVM.
Most notably, from 1995 to 1998, ownership of EVM criteria (reduced to 32) was transferred to industry by adoption of ANSI EIA 748-A standard.
It was adopted by the National Aeronautics and Space Administration, the United States Department of Energy and other technology-related agencies.
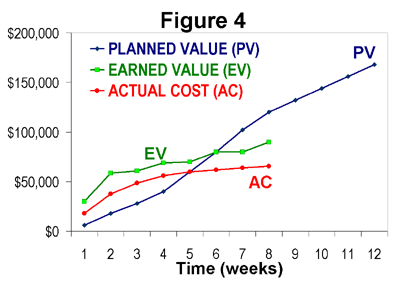
Figure 1 shows the cumulative budget (cost) for this project as a function of time (the blue line, labeled PV).
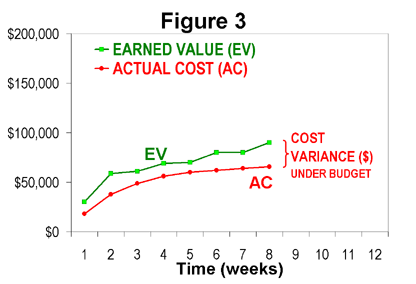
It also shows the cumulative actual cost of the project (red line, labeled AC) through week 8.
Progress can be tracked based on any measure – cost, hours, quantities, schedule, directly input percent complete, and more.
The chart indicates that technical performance (i.e. progress) started more rapidly than planned, but slowed significantly and fell behind schedule at week 7 and 8.
This is typically done in a hierarchical arrangement called a work breakdown structure (WBS), although the simplest projects may use a simple list of tasks.
Assigning weighted values and achieving consensus on all PV quantities yields an important benefit of EVM, because it exposes misunderstandings and miscommunications about the scope of the project, and resolving these differences should always occur as early as possible.
This is typically done at regular intervals (e.g. weekly or monthly), but there is no reason why EV cannot be accumulated in near real-time, when work elements are started/completed.
In fact, waiting to update EV only once per month (simply because that is when cost data are available) only detracts from a primary benefit of using EVM, which is to create a technical performance scoreboard for the project team.
One useful result of this very simple approach (without schedule models and actual cost accumulation) is to compare EV curves of similar projects, as illustrated in Figure 5.
This can sometimes even lead to performing activities out-of-sequence just to improve the schedule tracking metrics, which can cause major problems with quality.
In large projects, establishing control accounts is the primary method of delegating responsibility and authority to various parts of the performing organization.
Control accounts are cells of a responsibility assignment (RACI) matrix, which is the intersection of the project WBS and the organizational breakdown structure (OBS).
In addition to using BCWS and BCWP, implementations often use the term actual cost of work performed (ACWP) instead of AC.
If a project has a management reserve (MR), it is typically not included in the BAC, and respectively, in the performance measurement baseline.
If ETC pushes EAC to exceed BAC, then project management skills are employed to either recommend performance improvements or scope change, but never force ETC to give the "correct" answer so that EAC=BAC.
Many small projects don't satisfy either of these prerequisites, but they too can benefit from EVM, as described for simple implementations, above.
As a means of overcoming objections to EVM's lack of connection to qualitative performance issues, the Naval Air Systems Command (NAVAIR) PEO(A) organization initiated a project in the late 1990s to integrate true technical achievement into EVM projections by utilizing risk profiles.
These risk profiles anticipate opportunities that may be revealed and possibly be exploited as development and testing proceeds.
There is the difficulty inherent for any periodic monitoring of synchronizing data timing: actual deliveries, actual invoicing, and the date the EVM analysis is done are all independent, so that some items have arrived but their invoicing has not and by the time analysis is delivered the data will likely be weeks behind events.
This may limit EVM to a less tactical or less definitive role where use is combined with other forms to explain why or add recent news and manage future expectations.
This situation raises ethical issues for those involved, and creates an overhead in dealing with the reality of project work.
Further the Darling & Whitty study is pertinent as it provides sociological insight to how a scientific management technique has been implemented.