Evolutionary landscape
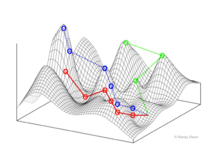
An evolutionary landscape is a metaphor[1] or a construct used to think about and visualize the processes of evolution (e.g. natural selection and genetic drift) acting on a biological entity[2] (e.g. a gene, protein, population, or species).
Smooth landscapes happen when most fixed mutations have little to no effect on fitness, which is what one would expect with the neutral theory of molecular evolution.
[4] In Janet's evolutionary landscape, a species is represented as a point or an area on a polydimensional surface of phenotypes, which is reduced to two dimensions for simplicity.
Unlike the evolutionary landscapes of those who would follow, in Janet's concept, natural selection pulls species toward the minima instead of the maxima.
[5] In his 1932 paper, Wright presents the concept of an evolutionary landscape composed of a polydimensional array of gene (allele) or genotype frequencies and an axis of fitness, which served as a visual metaphor to explain his shifting balance theory.
Natural selection drives populations toward maxima, while drift represents wandering and could potentially cause a peak shift.
[7] Lande considers fitness peaks to be determined by the environment and thus represent ecological niches or adaptive zones for a population.
This conceptual shift, along with the development of vast computational power, has allowed evolutionary landscapes to move from being a simple visual metaphor to a working model of evolution.
[1] As a visual metaphor, this might be a valid reduction; however, the work of Gavrilets has shown that taking the high dimensionality of evolutionary landscapes into consideration may matter.
It has heuristic value as a metaphorical tool allowing one to visualize and evaluate the common core of assumptions in an evolutionary model.
Morphospaces, pioneered by Raup (1966), are phenotypic landscapes developed a priori using mathematical models onto which observed measurements are mapped.
Adaptive landscapes and fitness surfaces can be used with caution, i.e. with the understanding that they are not phenotypic versions of Wright's original concept and that they are fraught with potentially misleading assumptions.
Finally, Pigliucci calls for further research into morphospaces due to their heuristic value but also their ability to generate understandable and testable hypotheses.
[10] Epigenetic landscapes are "used to describe modal developmental tendency and major deviations" with a "space of abstract variables.
Observational measurements are then mapped onto the resulting surface to indicate areas of possible phenotypic space occupied by the species under consideration.
[12] Recent increases in computational power and ease of sequencing have allowed the concept of evolutionary landscapes to be taken from a purely conceptual metaphor to something that can be modeled and explored.
"[14] In their study, Vasseur et al. were interested in the evolution of the innate immune system; specifically, they wished to map the genetic diversity—the occupied evolutionary landscape—and patterns of selection and diversification—the movements made and being made along that landscape—of the NOD-like receptor (NLR) family of the pattern-recognition receptors (PRRs) that drive the innate immune response.
The authors found that the NALP family was under strong purifying selection and exhibited low genetic and functional diversity.
Evidence in favor of this hypothesis comes from the independent discovery of rare alleles with mutations in two of the genes leading to a severe inflammatory disease and pregnancy complications.
To do this, they used a program called the Evolutionary Landscape Printer to design a synonymous version of the antibiotic resistance gene aac(6')-IB.
[15] The landscape of the original protein and the synonymous copy were explored computationally with Monte Carlo simulations and error-prone PCR.
From their results, the authors concluded that synonymous codons allow for a wider exploration of the local evolutionary landscape, and that the method they used increases the odds of finding an advantageous mutation, which is useful for predicting how a population might change and for designing better organisms for industry.