F-statistics
F-statistics can also be thought of as a measure of the correlation between genes drawn at different levels of a (hierarchically) subdivided population.
This correlation is influenced by several evolutionary processes, such as genetic drift, founder effect, bottleneck, genetic hitchhiking, meiotic drive, mutation, gene flow, inbreeding, natural selection, or the Wahlund effect, but it was originally designed to measure the amount of allelic fixation owing to genetic drift.
The concept of F-statistics was developed during the 1920s by the American geneticist Sewall Wright,[1][2] who was interested in inbreeding in cattle.
However, because complete dominance causes the phenotypes of homozygote dominants and heterozygotes to be the same, it was not until the advent of molecular genetics from the 1960s onwards that heterozygosity in populations could be measured.
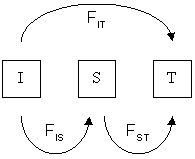
[further explanation needed] The measures FIS, FST, and FIT are related to the amounts of heterozygosity at various levels of population structure.
Together, they are called F-statistics, and are derived from F, the inbreeding coefficient.
In a simple two-allele system with inbreeding, the genotypic frequencies are: The value for
It is also the probability that at any locus, two alleles from a random individual of the population are identical by descent.
Ford (1971) on a single population of the scarlet tiger moth: From this, the allele frequencies can be calculated, and the expectation of
FIT is the inbreeding coefficient of an individual (I) relative to the total (T) population, as above; FIS is the inbreeding coefficient of an individual (I) relative to the subpopulation (S), using the above for subpopulations and averaging them; and FST is the effect of subpopulations (S) compared to the total population (T), and is calculated by solving the equation: as shown in the next section.
would be the ratio of the average number of differences between pairs of chromosomes sampled within diploid individuals with the average number obtained when sampling chromosomes randomly from the population (excluding the grouping per individual).
One can modify this definition and consider a grouping per sub-population instead of per individual.
[4][5][6][7][8] Later studies based on hundreds of thousands single-nucleotide polymorphism (SNPs) suggested that the genetic diversity between continental populations is even smaller and accounts for 3 to 7%[9][10][11][12][13][14] A later study based on three million SNPs found that 12% of the genetic variation is found between continental populations and only 1% within them.