Flammability diagram
Flammability diagrams show the control of flammability in mixtures of fuel, oxygen and an inert gas, typically nitrogen.
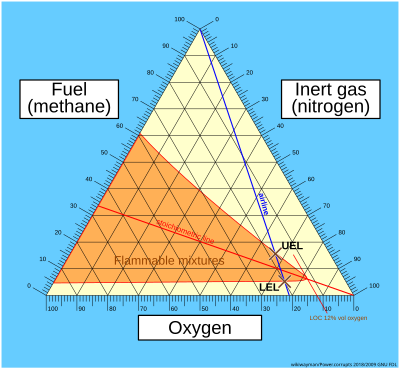
Mixtures of the three gasses are usually depicted in a triangular diagram, known as a ternary plot.
[1][2][3] The same information can be depicted in a normal orthogonal diagram, showing only two substances, implicitly using the feature that the sum of all three components is 100 percent.
The diagrams below only concerns one fuel; the diagrams can be generalized to mixtures of fuels.
The easiest way to understand them is to briefly go through three basic steps in their construction.