Gantt chart
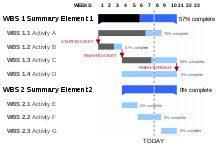
[2][3] Modern Gantt charts also show the dependency relationships between activities and the current schedule status.
Gantt charts can be used to show current schedule status using percent-complete shadings and a vertical "TODAY" line.
[4] Widely used in project planning in the present day, Gantt charts were considered revolutionary when introduced.
In 1912, Hermann Schürch [de] published what could be considered Gantt charts while discussing a construction project.
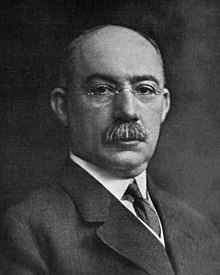
[17] One of the first major applications of Gantt charts was by the United States during World War I, at the instigation of General William Crozier.
[18] The earliest Gantt charts were drawn on paper and therefore had to be redrawn entirely in order to adjust to schedule changes.
For many years, project managers used pieces of paper or blocks for Gantt chart bars so they could be adjusted as needed.
[citation needed] By 2012, almost all Gantt charts were made by software which can easily adjust to schedule changes.
[9] Gantt chart software typically provides mechanisms to link task dependencies, although this data may or may not be visually represented.