Gompertz function
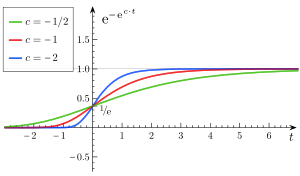
It is a sigmoid function which describes growth as being slowest at the start and end of a given time period.
This is in contrast to the simple logistic function in which both asymptotes are approached by the curve symmetrically.
The function was originally designed to describe human mortality, but since has been modified to be applied in biology, with regard to detailing populations.
It is based on the assumption that the mortality rate increases exponentially as a person ages.
Earlier work on the construction of functional models of mortality was done by the French mathematician Abraham de Moivre (1667–1754) in the 1750s.
An extension to Gompertz's work was proposed by the English actuary and mathematician William Matthew Makeham (1826–1891) in 1860, who added a constant background mortality rate to Gompertz's exponentially increasing one.
This function is especially useful in describing the rapid growth of a certain population of organisms while also being able to account for the eventual horizontal asymptote, once the carrying capacity is determined (plateau cell/population number).
where: This function consideration of the plateau cell number makes it useful in accurately mimicking real-life population dynamics.
Moreover, the function makes use of initial growth rate, which is commonly seen in populations of bacterial and cancer cells, which undergo the log phase and grow rapidly in numbers.
Despite its popularity, the function initial rate of tumor growth is difficult to predetermine given the varying microcosms present with a patient, or varying environmental factors in the case of population biology.
In cancer patients, factors such as age, diet, ethnicity, genetic pre-dispositions, metabolism, lifestyle and origin of metastasis play a role in determining the tumor growth rate.
The carrying capacity is also expected to change based on these factors, and so describing such phenomena is difficult.
This function can be applied to monitor tumor cells; metabolic rate is dynamic and is greatly flexible, making it more precise in detailing cancer growth.
The metabolic curve takes in to consideration the energy the body provides in maintaining and creating tissue.
This energy can be considered as metabolism and follows a specific pattern in cellular division.
Energy conservation can be used to model such growth, irrespective of differing masses and development times.
All taxa share a similar growth pattern and this model, as a result, considers cellular division, the foundation of the development of a tumor.
The use of these two factors, alongside the energy required to create new tissue, comprehensively map the rate of growth, and moreover, lead in to an accurate representation of the lag phase.
Laird[13] for the first time successfully used the Gompertz curve to fit data of growth of tumors.
In fact, tumors are cellular populations growing in a confined space where the availability of nutrients is limited.
F(X) is the instantaneous proliferation rate of the cellular population, whose decreasing nature is due to the competition for the nutrients due to the increase of the cellular population, similarly to the logistic growth rate.
However, there is a fundamental difference: in the logistic case the proliferation rate for small cellular population is finite:
As noticed by Steel[14] and by Wheldon,[15] the proliferation rate of the cellular population is ultimately bounded by the cell division time.
Thus, this might be an evidence that the Gompertz equation is not good to model the growth of small tumors.
The theoretical study by Fornalski et al.[17] showed the biophysical basis of the Gompertz curve for cancer growth except very early phase where parabolic function is more appropriate.
They found also that the Gompertz curve describes the most typical case among the broad family of the cancer dynamics’ functions.
In the Gomp-Ex model it is assumed that initially there is no competition for resources, so that the cellular population expands following the exponential law.
Outside of the range defined by the vertical asymptotes, the inverse function requires computing the logarithm of negative numbers.
For instance, certain ELISA assays have a standard curve whose concentrations can be fit extremely well to their optical density by a Gompertz function.
Once the standards are thus fit to a Gompertz function, calculating the unknown concentration of samples in the assay from their measured optical density is achieved using the inverse of the Gompertz function that was produced when fitting the standard curve.