Gravity anomaly
If the Earth were an ideal oblate spheroid of uniform density, then the gravity measured at every point on its surface would be given precisely by a simple algebraic expression.
Careful analysis of the gravity data allows geologists to make inferences about the subsurface geology.
[1] Typically the model is based on simplifying assumptions, such as that, under its self-gravitation and rotational motion, the planet assumes the figure of an ellipsoid of revolution.
[3] Gravity anomalies were first discovered in 1672, when the French astronomer Jean Richer established an observatory on the island of Cayenne.
Richer was equipped with a highly precise pendulum clock which had been carefully calibrated at Paris before his departure.
However, he found that the clock ran too slowly in Cayenne, compared with the apparent motion of the stars.
Fifteen years later, Isaac Newton used his newly formulated universal theory of gravitation to explain the anomaly.
[6] The normal gravity accounts for the bulk gravitation of the entire Earth, corrected for its idealized shape and rotation.
When greater precision is needed, a more elaborate formula gives the normal gravity with an accuracy of 0.0001 mgal.
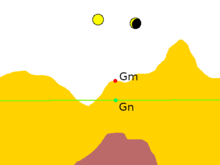
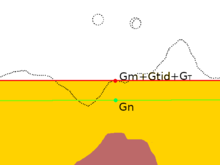
[7] The Sun and Moon create time-dependent tidal forces that affect the measured value of gravity by about 0.3 mgal.
This effect is very well understood and can be calculated precisely for a given time and location using astrophysical data and formulas, to yield the tidal correction △gtid.
The terrain correction is calculated from knowledge of the local topography and estimates of the density of the rock making up the high ground.
For a measurement point above the reference ellipsoid, this means that the gravitational attraction of the bulk mass of the earth is slightly reduced.
The free-air anomaly does not take into account the layer of material (after terrain leveling) outside the reference ellipsoid.
The density of crustal rock, ρ, is usually taken to be 2670 kg m−3 so the Bouguer plate correction is usually taken as −0.1119 mgal m−1 h. Here h is the elevation above the reference ellipsoid.
The Bouguer anomaly is positive over ocean basins and negative over high continental areas.
[17] Lateral variations in gravity anomalies are related to anomalous density distributions within the Earth.
[15] The Bouger anomaly map of the Alps shows additional features besides the expected deep mountain roots.
A positive anomaly is associated with the Ivrea body, a wedge of dense mantle rock caught up by an ancient continental collision.
[21] Over mid-ocean ridges, the free-air anomalies are small and correlate with the ocean bottom topography.
This is consistent with seismic data and suggests the presence of a low-density magma chamber under the ridge axis.
The free-air anomaly is around +70 mgal along the Andes coast, and this is attributed to the subducting dense slab.
[24] Gravity anomalies provide clues on other processes taking place deep in the lithosphere.
For example, the formation and sinking of a lithospheric root may explain negative isostatic anomalies in eastern Tien Shan.
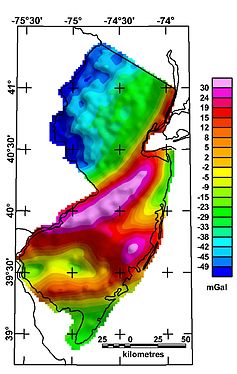
[27] At scales between entire mountain ranges and ore bodies, Bouguer anomalies may indicate rock types.
For example, the northeast-southwest trending high across central New Jersey represents a graben of Triassic age largely filled with dense basalts.
[28] The largest continental gravity gradient in the world is found across the Woodroffe Thrust-Mann Fault Zone in central Australia, and is attributed to an upthrust of dense mantle material 30 km closer to the present land surface, which occurred during the 630–520 Ma Petermann Orogeny.
[29][30] Currently, the static and time-variable Earth's gravity field parameters are determined using modern satellite missions, such as GOCE, CHAMP, Swarm, GRACE and GRACE-FO.
[31][32] The lowest-degree parameters, including the Earth's oblateness and geocenter motion are best determined from satellite laser ranging.
These satellite missions aim at the recovery of a detailed gravity field model of the Earth, typically presented in the form of a spherical-harmonic expansion of the Earth's gravitational potential, but alternative presentations, such as maps of geoid undulations or gravity anomalies, are also produced.