Greenland ice sheet
[18] If the Paris Agreement goal of staying below 2 °C (3.6 °F) is achieved, melting of Greenland ice alone would still add around 6 cm (2+1⁄2 in) to global sea level rise by the end of the century.
[7] While there is evidence of large glaciers in Greenland for most of the past 18 million years,[7] these ice bodies were probably similar to various smaller modern examples, such as Maniitsoq and Flade Isblink, which cover 76,000 and 100,000 square kilometres (29,000 and 39,000 sq mi) around the periphery.
Conditions in Greenland were not initially suitable for a single coherent ice sheet to develop, but this began to change around 10 million years ago, during the middle Miocene, when the two passive continental margins which now form the uplands of West and East Greenland experienced uplift, and ultimately formed the upper planation surface at a height of 2000 to 3000 meter above sea level.
This uplift intensified glaciation due to increased orographic precipitation and cooler surface temperatures, allowing ice to accumulate and persist.
[29][30] As recently as 3 million years ago, during the Pliocene warm period, Greenland's ice was limited to the highest peaks in the east and the south.
[14] Sediment samples from the Labrador Sea provide evidence that nearly all of the south Greenland ice had melted around 400,000 years ago, during Marine Isotope Stage 11.
[12] These findings suggest that less than 10% of the current ice sheet volume was left during those geologically recent periods, when the temperatures were less than 2.5 °C (4.5 °F) warmer than preindustrial conditions.
[38][39] When properly analyzed, ice cores provide a wealth of proxies suitable for reconstructing the past temperature record,[37] precipitation patterns,[40] volcanic eruptions,[41] solar variation,[38] ocean primary production,[39] and even changes in soil vegetation cover and the associated wildfire frequency.
[53] Greenland's net contribution for the 2012–2016 period was equivalent to 37% of sea level rise from land ice sources (excluding thermal expansion).
[79] Since then, it has remained comparatively stable near its 2005 position, losing relatively little mass in comparison to Jacobshavn and Kangerlussuaq,[80] although it may have eroded sufficiently to experience another rapid retreat in the near future.
[83][84] Since the early 2000s, glaciologists have concluded that glacier retreat in Greenland is accelerating too quickly to be explained by a linear increase in melting in response to greater surface temperatures alone, and that additional mechanisms must also be at work.
[93] By 2016, waters across much of West Greenland's coastline had warmed by 1.6 °C (2.9 °F) relative to 1990s, and some of the smaller glaciers were losing more ice to such melting than normal calving processes, leading to rapid retreat.
[95][96] This sensitivity meant that an influx of cooler ocean water to its location was responsible for its slowdown after 2015,[73] in large part because the sea ice and icebergs immediately off-shore were able to survive for longer, and thus helped to stabilize the glacier.
There, it lubricates the base of the glaciers and generates higher basal pressure, which collectively reduces friction and accelerates glacial motion, including the rate of ice calving.
[104] In certain fjords, large meltwater flows from beneath the ice may mix with ocean water to create turbulent plumes that can be damaging to the calving front.
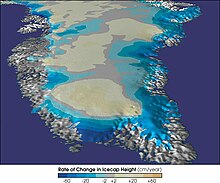
[4] For instance, the ice sheet's interior thickened by an average of 6 cm (2.4 in) each year between 1994 and 2005, in part due to a phase of North Atlantic oscillation increasing snowfall.
[135] Due to the enormous thickness of the central Greenland ice sheet, even the most extensive melting event can only affect a small fraction of it before the start of the freezing season, and so they are considered "short-term variability" in the scientific literature.
Nevertheless, their existence is important: the fact that the current models underestimate the extent and frequency of such events is considered to be one of the main reasons why the observed ice sheet decline in Greenland and Antarctica tracks the worst-case rather than the moderate scenarios of the IPCC Fifth Assessment Report's sea-level rise projections.
[141] These low temperatures are in part caused by the high albedo of the ice sheet, as its bright white surface is very effective at reflecting sunlight.
[154] Some research suggests that Greenland's meltwater mainly benefits marine productivity not by adding carbon and iron, but through stirring up lower water layers that are rich in nitrates and thus bringing more of those nutrients to phytoplankton on the surface.
[160][161] In 2021, research claimed that there must be mineral deposits of mercury (a highly toxic heavy metal) beneath the southwestern ice sheet, because of the exceptional concentrations in meltwater entering the local fjords.
[164] However, there is still a risk of toxic waste being released from Camp Century, formerly a United States military site built to carry nuclear weapons for the Project Iceworm.
[168][169][170][171] In 2016, a study attempted to improve forecasts of future AMOC changes by incorporating better simulation of Greenland trends into projections from eight state-of-the-art climate models.
[180] On the other hand, the three largest glaciers - Jacobshavn, Helheim, and Kangerlussuaq - are all located in the southern half of the ice sheet, and just the three of them are expected to add 9.1–14.9 mm under RCP 8.5.
[58] If Greenland were to lose all of its coastal glaciers, though, then whether or not it will continue to shrink will be entirely determined by whether its surface melting in the summer consistently outweighs ice accumulation during winter.
[190][191] Some estimates suggest that the most vulnerable and fastest-receding parts of the ice sheet have already passed "a point of no return" around 1997, and will be committed to disappearance even if the temperature stops rising.
[139] Another paper suggested that paleoclimate evidence from 400,000 years ago is consistent with ice losses from Greenland equivalent to at least 1.4 m (4+1⁄2 ft) of sea level rise in a climate with temperatures close to 1.5 °C (2.7 °F), which are now inevitable at least in the near future.
[195] That lowered temperature range had been widely used in the subsequent literature,[34][196] and in the year 2015, prominent NASA glaciologist Eric Rignot claimed that "even the most conservative people in our community" will agree that "Greenland’s ice is gone" after 2 °C (3.6 °F) or 3 °C (5.4 °F) of global warming.
However, while that would avert the loss of the entire ice sheet, it would increase the overall sea level rise by up to several meters, as opposed to a scenario where the warming threshold was not breached in the first place.
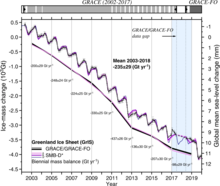
[6] Another paper using a more complex ice sheet model has found that since the warming passed 0.6 °C (1.1 °F) degrees, ~26 cm (10 in) of sea level rise became inevitable,[5] closely matching the estimate derived from direct observation in 2022.