Climate sensitivity
If climate sensitivity turns out to be on the high side of scientific estimates, the Paris Agreement goal of limiting global warming to below 2 °C (3.6 °F) will be even more difficult to achieve.
A warmer planet radiates heat to space faster and so a new balance is eventually reached, with a higher temperature and stored energy content.
[5] Radiative forcings are generally quantified as Watts per square meter (W/m2) and averaged over Earth's uppermost surface defined as the top of the atmosphere.
[6] The magnitude of a forcing is specific to the physical driver and is defined relative to an accompanying time span of interest for its application.
One study suggests that halving the uncertainty of the value for transient climate response (TCR) could save trillions of dollars.
One study estimated that emissions cannot be reduced fast enough to meet the 2 °C goal if equilibrium climate sensitivity (the long-term measure) is higher than 3.4 °C (6.1 °F).
[4] The more sensitive the climate system is to changes in greenhouse gas concentrations, the more likely it is to have decades when temperatures are much higher or much lower than the longer-term average.
[18][19] The radiative forcing caused by a doubling of atmospheric CO2 levels (from the pre-industrial 280 ppm) is approximately 3.7 watts per square meter (W/m2).
[21] Balancing feedbacks tend to counteract warming by increasing the rate at which energy is radiated to space from a warmer planet.
[30] A related measure is the transient climate response to cumulative carbon emissions (TCRE), which is the globally averaged surface temperature change after 1000 GtC of CO2 has been emitted.
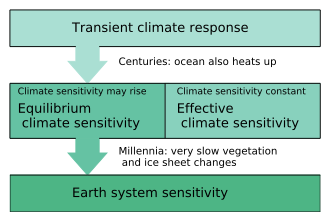
It is a prediction of the new global mean near-surface air temperature once the CO2 concentration has stopped increasing, and most of the feedbacks have had time to have their full effect.
[35] The long time scales involved with ECS make it arguably a less relevant measure for policy decisions around climate change.
Volcanic atmospheric composition changes are thought to have provided the radiative forcing needed to escape the snowball state.
The Paleocene–Eocene Thermal Maximum, about 55.5 million years ago, was unusually warm and may have been characterized by above-average climate sensitivity.
The effect of any change in climate sensitivity is expected to be small or negligible in the first century after additional CO2 is released into the atmosphere.
[51] Radiative forcing is often modelled because Earth observation satellites measuring it has existed during only part of the Industrial Age (only since the late 1950s).
[51][53][54][55] Estimates of transient climate response (TCR) that have been calculated from models and observational data can be reconciled if it is taken into account that fewer temperature measurements are taken in the polar regions, which warm more quickly than the Earth as a whole.
Computation of the equilibrium climate sensitivity, S (°C), using the radiative forcing ΔF (W/m2) and the measured temperature rise, would then be possible.
In 2011, the radiative forcing from CO2 and other long-lived greenhouse gases (mainly methane, nitrous oxide, and chlorofluorocarbon) that have been emitted since the 18th century was roughly 2.8 W/m2.
Because the eruptions caused a larger and less well-quantified decrease in radiative forcing than the reduced solar irradiance, it is questionable whether useful quantitative conclusions can be derived from the observed temperature variations.
[71] The Paleocene–Eocene Thermal Maximum (about 55.5 million years ago), a 20,000-year period during which massive amount of carbon entered the atmosphere and average global temperatures increased by approximately 6 °C (11 °F), also provides a good opportunity to study the climate system when it was in a warm state.
[73] As the name suggests, the Last Glacial Maximum was much colder than today, and good data on atmospheric CO2 concentrations and radiative forcing from that period are available.
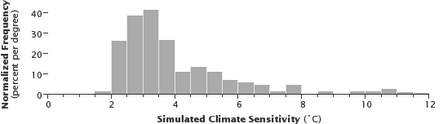
[86][87][88] Ensemble climate models developed at different institutions tend to produce constrained estimates of ECS that are slightly higher than 3 °C (5.4 °F).
[94] Assuming constant humidity, they computed an equilibrium climate sensitivity of 2.3 °C per doubling of CO2, which they rounded to 2 °C, the value most often quoted from their work, in the abstract of the paper.
"[96] A committee on anthropogenic global warming, convened in 1979 by the United States National Academy of Sciences and chaired by Jule Charney,[97] estimated equilibrium climate sensitivity to be 3 °C (5.4 °F), plus or minus 1.5 °C (2.7 °F).
According to Manabe, speaking in 2004, "Charney chose 0.5 °C as a reasonable margin of error, subtracted it from Manabe's number, and added it to Hansen's, giving rise to the 1.5 to 4.5 °C (2.7 to 8.1 °F) range of likely climate sensitivity that has appeared in every greenhouse assessment since ...."[98] In 2008, climatologist Stefan Rahmstorf said: "At that time [it was published], the [Charney report estimate's] range [of uncertainty] was on very shaky ground.
[106] The 2013 IPCC Fifth Assessment Report reverted to the earlier range of 1.5 to 4.5 °C (2.7 to 8.1 °F) (with high confidence), because some estimates using industrial-age data came out low.
[100] In preparation for the 2021 IPCC Sixth Assessment Report, a new generation of climate models was developed by scientific groups around the world.
[111][109][112][113] Remaining deficiencies in the simulation of clouds may have led to overestimates,[114] as models with the highest ECS values were not consistent with observed warming.
[115] A fifth of the models began to 'run hot', predicting that global warming would produce significantly higher temperatures than is considered plausible.