History of the oscilloscope
The first recordings of waveforms were with a galvanometer coupled to a mechanical drawing system dating from the second decade of the 19th century.
By slowly advancing around the rotor, a general standing wave can be drawn on graphing paper by recording the degrees of rotation and the meter strength at each position.
This process was first partially automated by Jules François Joubert [fr] with his step-by-step method of wave form measurement.
The contact point could be moved around the rotor following a precise degree indicator scale and the output appearing on a galvanometer, to be hand-graphed by the technician.
The term "oscillograph" was coined by André Blondel in 1893 to refer to his instrument based on the earlier-known mirror galvanometer but adapted to recording high-frequency oscillations.
Although the measurements were much more precise than the built-up paper recorders, there was still room for improvement due to having to develop the exposed images before they could be examined.
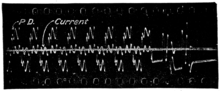
A time base, unsynchronized, was provided by a spinning mirror polygon, and a collimated beam of light from an arc lamp projected the waveform onto the lab wall or a screen.
[13] Moving-paper oscillographs using UV-sensitive paper and advanced mirror galvanometers provided multi-channel recordings in the mid-20th century.
With only vertical deflection applied to the internal plates, the face of the tube was observed through a rotating mirror to provide a horizontal time base.
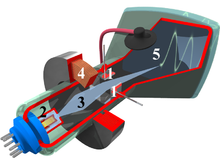
[14] In 1899 Jonathan Zenneck equipped the cathode ray tube with beam-forming plates and used a magnetic field for sweeping the trace.
This stable and reproducible component allowed General Radio to manufacture an oscilloscope that was usable outside a laboratory setting.
[17] Long-persistence CRTs, sometimes used in oscilloscopes for displaying slowly changing signals or single-shot events, used a phosphor such as P7, which comprised a double layer.
This type of phosphor was also used in radar analog PPI CRT displays, which are a graphic decoration (rotating radial light bar) in some TV weather-report scenes.
The operator would adjust the charging current so the sawtooth generator would have a slightly longer period than a multiple of the vertical axis signal.
These oscilloscopes were used for applications where the horizontal trace speed was very slow, or there was a long delay between sweeps, to provide a persistent screen image.
[21] As oscilloscopes have become more powerful over time, enhanced triggering options allow capture and display of more complex waveforms.
In 1963, Tektronix introduced the Direct View Bistable Storage Tube (DVBST), which allowed observing single pulse waveforms rather than (as previously) only repeating wave forms.
Using micro-channel plates, a variety of secondary-emission electron multiplier inside the CRT and behind the faceplate, the most advanced analog oscilloscopes (for example, the Tek 7104 mainframe) could display a visible trace (or allow the photography) of a single-shot event even when running at extremely fast sweep speeds.
In vacuum-tube oscilloscopes made by Tektronix, the vertical amplifier's delay line was a long frame, L-shaped for space reasons, that carried several dozen discrete inductors and a corresponding number of low-capacitance adjustable ("trimmer") cylindrical capacitors.
For adjusting the delay line capacitors, a high-pressure gas-filled mercury-wetted reed switch created extremely fast-rise pulses which went directly to the later stages of the vertical amplifier.
With a fast sweep, any misadjustment created a dip or bump, and touching a capacitor made its local part of the waveform change.
Vacuum-tube output stages in early wideband oscilloscopes used radio transmitting tubes, but they consumed a lot of power.
[citation needed] It used a low-speed analog-to-digital converter (1 MHz, 12 bit) used primarily for vibration and medical analysis.