Hockey stick graph (global temperature)
Political disputes led to the formation of a panel of scientists convened by the United States National Research Council, their North Report in 2006 supported Mann's findings with some qualifications, including agreeing that there were some statistical failings but these had little effect on the result.
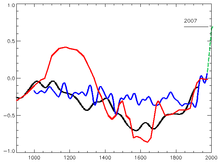
[12] More than two dozen reconstructions, using various statistical methods and combinations of proxy records, support the broad consensus shown in the original 1998 hockey-stick graph, with variations in how flat the pre-20th century "shaft" appears.
Paleoclimatology influenced the 19th century physicists John Tyndall and Svante Arrhenius who found the greenhouse gas effect of carbon dioxide (CO2) in the atmosphere to explain how past ice ages had ended.
[26] Archives of climate proxies were developed: in 1993 Raymond S. Bradley and Phil Jones composited historical records, tree-rings and ice cores for the Northern Hemisphere from 1400 up to the 1970s to produce a decadal reconstruction.
This method was implemented in various ways, including different selection processes for the proxy records, and averaging could be unweighted, or could be weighted in relation to an assessment of reliability or of area represented.
Tree ring specialist Keith Briffa's February 1998 study showed that this problem was more widespread at high northern latitudes, and warned that it had to be taken into account to avoid overestimating past temperatures.
They were able to detect that the multiple proxies were varying in a coherent oscillatory way, indicating both the multidecadal pattern in the North Atlantic and a longer term oscillation of roughly 250 years in the surrounding region.
[37][38] For his postdoctoral research Mann joined Bradley and tree ring specialist Malcolm K. Hughes to develop a new statistical approach to reconstruct underlying spatial patterns of temperature variation combining diverse datasets of proxy information covering different periods across the globe, including a rich resource of tree ring networks for some areas and sparser proxies such as lake sediments, ice cores and corals, as well as some historical records.
[41] The primary aim of CFR methods was to provide the spatially resolved reconstructions essential for coherent geophysical understanding of how parts of the climate system varied and responded to radiative forcing, so hemispheric averages were a secondary product.
Their original draft ended in 1980 as most reconstructions only went that far, but an anonymous peer reviewer of the paper suggested that the curve of instrumental temperature records should be shown up to the present to include the considerable warming that had taken place between 1980 and 1998.
[43] The Mann, Bradley & Hughes 1998 (MBH98) multiproxy study on "Global-scale temperature patterns and climate forcing over the past six centuries" was submitted to the journal Nature on 9 May 1997, accepted on 27 February 1998 and published on 23 April 1998.
[44] In a review in the same issue, Gabriele C. Hegerl described their method as "quite original and promising", which could help to verify model estimates of natural climate fluctuations and was "an important step towards reconstructing space–time records of historical temperature patterns".
Climatologist Tom Wigley welcomed the progress made in the study, but doubted if proxy data could ever be wholly convincing in detecting the human contribution to changing climate.
[52] Jones, Keith Briffa, Tim P. Barnett and Simon Tett had independently produced a "Composite Plus Scale" (CPS) reconstruction extending back for a thousand years, comparing tree ring, coral layer, and glacial proxy records, but not specifically estimating uncertainties.
He found that certain proxies were critical to the reliability of the reconstruction, particularly one tree ring dataset collected by Gordon Jacoby and Rosanne D'Arrigo in a part of North America Bradley's earlier research had identified as a key region.
"[60][61] With work progressing on the next IPCC report, Chris Folland told researchers on 22 September 1999 that a figure showing temperature changes over the millennium "is a clear favourite for the policy makers' summary".
[62] Briffa's paper as published in the January 2000 issue of Quaternary Science Reviews showed the unusual warmth of the last century, but cautioned that the impact of human activities on tree growth made it subtly difficult to isolate a clear climate message.
While earlier reconstructed temperature variations were consistent with volcanic and solar irradiation changes plus residual variability, very large 20th-century warming closely agreed with the predicted effects of greenhouse gas emissions.
[8] Its Figure 2.21 showed smoothed curves from the MBH99, Jones et al. and Briffa reconstructions, together with modern thermometer data as a red line and the grey shaded 95% confidence range from MBH99.
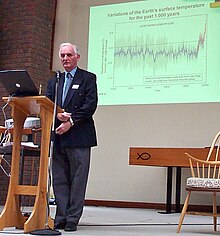
A large poster of the IPCC illustration based on the MBH99 graph formed the backdrop when Sir John T. Houghton, as co-chair of the working group, presented the report in an announcement shown on television, leading to wide publicity.
[10] On 8 July Eos featured a detailed rebuttal of both papers by 13 scientists including Mann and Jones, presenting strong evidence that Soon and Baliunas had used improper statistical methods.
[88][89] The McIntyre & McKitrick 2003b paper (MM03) said that the Mann, Bradley & Hughes 1998 (MBH98) "hockey stick" shape was "primarily an artefact of poor data handling and use of obsolete proxy records.
[92] The statistical methods used in the MBH reconstruction were questioned in a 2004 paper by Hans von Storch with a team including Eduardo Zorita,[93] which said that the methodology used to average the data and the wide uncertainties might have hidden abrupt climate changes, possibly as large as the 20th century spike in measured temperatures.
[78] Other researchers subsequently found that the von Storch paper had an undisclosed additional step which, by detrending data before estimating statistical relationships, had removed the main pattern of variation.
[107][108] Sherwood Boehlert, chairman of the House Science Committee, told his fellow Republican Joe Barton it was a "misguided and illegitimate investigation" apparently aimed at intimidating scientists.
[123][124] Using various high-resolution proxies including tree rings, ice cores and sediments, Mann and Jones published reconstructions in August 2003 which indicated that "late 20th century warmth is unprecedented for at least roughly the past two millennia for the Northern Hemisphere.
This featured a graph showing 12 proxy based temperature reconstructions, including the three highlighted in the IPCC Third Assessment Report (TAR); Mann, Bradley & Hughes 1999 as before, Jones et al. 1998 and Briffa 2000 had both been calibrated by newer studies.
Their findings showed a long term cooling trend consistent with cycles in the Earth's orbit which would be expected to continue for a further 4,000 years but had been reversed in the 20th century by a sudden rise attributed to greenhouse gas emissions.
[140] Further support for the "hockey stick" graph came from a new method of analysis using Bayesian statistics developed by Martin Tingley and Peter Huybers of Harvard University, which produced the same basic shape, albeit with more variability in the past, and found the 1990s to have been the warmest decade in the 600-year period the study covered.
There were still issues of large-scale natural variability to be resolved, especially for the lowest frequency variations, and they called for further research to improve expert assessment of proxies and to develop reconstruction methods explicitly allowing for structural uncertainties in the process.


