Homogenization (climate)
These datasets are essential since they are the basis for assessing century-scale trends or for studying the natural (long-term) variability of climate, amongst others.
Results from the homogenization of instrumental western climate records indicate that detected inhomogeneities in mean temperature series occur at a frequency of roughly 15 to 20 years.
[1][2][3][4][5] It should be kept in mind that most measurements have not been specifically made for climatic purposes, but rather to meet the needs of weather forecasting, agriculture and hydrology.
However, certain changes are typical for certain periods and occurred in many stations, these are the most important causes as they can collectively lead to artificial biases in climate trends across large regions.
On the other hand, with the advent of aviation, many meteorological offices and thus their stations have often been relocated from cities to nearby, typically cooler, airports.
This improves ventilation, but it was found that infra-red radiation from the ground can influence the measurement on sunny calm days.
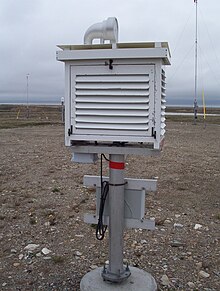
Nowadays automatic weather stations, which reduce labor costs, are becoming more common; they protect the thermometer by a number of white plastic cones.
Other typical causes of inhomogeneities are a change in measurement location; many observations, especially of precipitation are performed by volunteers in their garden or at their work place.
From the perspective of global warming, such local effects are undesirable, but to study the influence of climate on health such measurements are fine.
Other inhomogeneities are due to compromises that have to be made between ventilation and protection against the sun and wetting in the design of a weather shelter.
In such a difference time series, a clear and persistent jump of, for example 1 °C, can easily be detected and can only be due to changes in the measurement conditions.
If there is a clear and large break at a certain date, one may be able to correct it, but smaller jumps and gradually occurring inhomogeneities (urban heat island or a growing vegetation) cannot be distinguished from real natural variability and climate change.
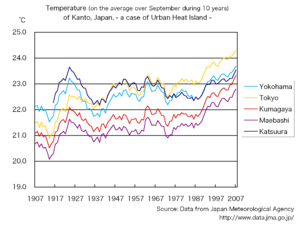
For example, for the Greater Alpine Region a bias in the temperature trend between the 1870s and 1980s of half a degree was found, which was due to decreasing urbanization of the network and systematic changes in the time of observation.
[16] The precipitation records of the early instrumental period are biased by -10% due to the systematic higher installation of the gauges at the time.
[17] Other possible bias sources are new types of weather shelters[3][18] the change from liquid and glass thermometers to electrical resistance thermometers,[2] as well as the tendency to replace observers by automatic weather stations,[8] the urban heat island effect and the transfer of many urban stations to airports.
[9] Moreover, state-of-the-art relative homogenization algorithms developed to work with an inhomogeneous reference are shown to perform best.