Human genetic clustering
[5][6] Notably, the practice of defining clusters among modern human populations is largely arbitrary and variable due to the continuous nature of human genotypes; although individual genetic markers can be used to produce smaller groups, there are no models that produce completely distinct subgroups when larger numbers of genetic markers are used.
[1][13] There are caveats and limitations to genetic clustering methods of any type, given the degree of admixture and relative similarity within the human population.
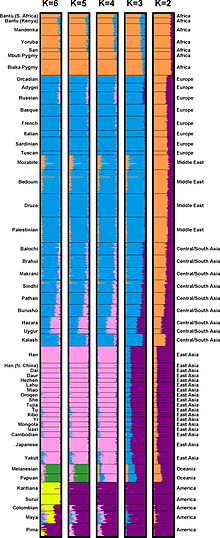
[1][8] In particular, the use of STRUCTURE has been widely criticized as being potentially misleading through requiring data to be sorted into a predetermined number of clusters which may or may not reflect the actual population's distribution.
[8][14] The creators of STRUCTURE originally described the algorithm as an "exploratory" method to be interpreted with caution and not as a test with statistically significant power.
[9][4] However, genetic variation is distributed in a complex, continuous, and overlapping manner, so this correlation is imperfect and the use of racial categories in medicine can introduce additional hazards.
Due to migration, gene flow, and baseline homogeneity, features between groups are extensively overlapping and intermixed.
[7] In general, clusters may most simply be understood as products of the methods used to sample and analyze genetic data; not without meaning for understanding ancestry and genetic characteristics, but inadequate to fully explaining the concept of race, which is more often described in terms of social and cultural forces.
In the related context of personalized medicine, race is currently listed as a risk factor for a wide range of medical conditions with genetic and non-genetic causes.
[3][26] Researchers are careful to emphasize that ancestry—revealed in part through cluster analyses—plays an important role in understanding risk of disease.