Hydrograph
[1] The term can also refer to a graph showing the volume of water reaching a particular outfall, or location in a sewerage network.
Because the timing, magnitude, and duration of groundwater return flow differs so greatly from that of direct runoff, separating and understanding the influence of these distinct processes is key to analyzing and simulating the likely hydrologic effects of various land use, water use, weather, and climate conditions and changes.
The UH technique provides a practical and relatively easy-to-apply tool for quantifying the effect of a unit of rainfall on the corresponding runoff from a particular drainage basin.
An instantaneous unit hydrograph is a further refinement of the concept; for an IUH, the input rainfall is assumed to all take place at a discrete point in time (obviously, this isn't the case for actual rainstorms).
In subsurface hydrology (hydrogeology), a hydrograph is a record of the water level (the observed hydraulic head in wells screened across an aquifer).
Raster hydrographs are pixel-based plots for visualizing and identifying variations and changes in large multidimensional data sets.
Originally developed by Keim (2000) they were first applied in hydrology by Koehler (2004) as a means of highlighting inter-annual and intra-annual changes in streamflow.
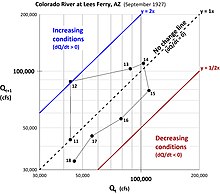
This technique allows data properties such as Q, dQ/dt, and d2Q/dt2, and trends of increasing, decreasing or no change flow to be readily seen and understood on a single graph.
The methodology is based on the time-series serial correlation lag-1 graph and uses the normally unwanted (but still valuable) autocorrelation present within the streamflow data.