Ice core
The proportions of different oxygen and hydrogen isotopes provide information about ancient temperatures, and the air trapped in tiny bubbles can be analysed to determine the level of atmospheric gases such as carbon dioxide.
Some volcanic events that were sufficiently powerful to send material around the globe have left a signature in many different cores that can be used to synchronise their time scales.
[1] An ice core is a vertical column through a glacier, sampling the layers that formed through an annual cycle of snowfall and melt.
These include soot, ash, and other types of particle from forest fires and volcanoes; isotopes such as beryllium-10 created by cosmic rays; micrometeorites; and pollen.
[9] Cores are often drilled in areas such as Antarctica and central Greenland where the temperature is almost never warm enough to cause melting, but the summer sunlight can still alter the snow.
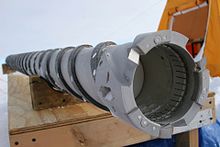
An auger is essentially a cylinder with helical metal ribs (known as flights) wrapped around the outside, at the lower end of which are cutting blades.
Since retrieval of each segment of core requires tripping, a slower speed of travel through the drilling fluid could add significant time to a project—a year or more for a deep hole.
The fluid must contaminate the ice as little as possible; it must have low toxicity, for safety and to minimize the effect on the environment; it must be available at a reasonable cost; and it must be relatively easy to transport.
[12][18] Along with the logistical difficulties associated with bringing heavy equipment to ice sheets, this makes traditional rotary drills unattractive.
The EastGRIP project, for example, which as of 2017 is drilling in eastern Greenland, is run by the Centre for Ice and Climate (Niels Bohr Institute, University of Copenhagen) in Denmark,[27] and includes representatives from 12 countries on its steering committee.
When the cores are flown from the drilling site, the aircraft's flight deck is unheated to help maintain a low temperature; when they are transported by ship they must be kept in a refrigeration unit.
When the core is brought to the surface, the bubbles can exert a stress that exceeds the tensile strength of the ice, resulting in cracks and spall.
[36][38] Many different kinds of analysis are performed on ice cores, including visual layer counting, tests for electrical conductivity and physical properties, and assays for inclusion of gases, particles, radionuclides, and various molecular species.
The very small quantities typically found require at least 300 g of ice to be used, limiting the ability of the technique to precisely assign an age to core depths.
[53][54] The boundary between the Pleistocene and the Holocene, about 11,700 years ago, is now formally defined with reference to data on Greenland ice cores.
According to Richard Alley, "In many ways, ice cores are the 'rosetta stones' that allow development of a global network of accurately dated paleoclimatic records using the best ages determined anywhere on the planet".
Plots of MF data over time reveal variations in the climate, and have shown that since the late 20th century melting rates have been increasing.
It was once thought that this meant it was unnecessary to measure both ratios in a given core, but in 1979 Merlivat and Jouzel showed that the deuterium excess reflects the temperature, relative humidity, and wind speed of the ocean where the moisture originated.
[73] Water isotope records, analyzed in cores from Camp Century and Dye 3 in Greenland, were instrumental in the discovery of Dansgaard-Oeschger events—rapid warming at the onset of an interglacial, followed by slower cooling.
[75] It was understood in the 1960s that analyzing the air trapped in ice cores would provide useful information on the paleoatmosphere, but it was not until the late 1970s that a reliable extraction method was developed.
[80][81] Greenland cores, during times of climatic transition, may show excess CO2 in air bubbles when analysed, due to CO2 production by acidic and alkaline impurities.
When a known volcanic event, such as the eruption of Laki in Iceland in 1783, can be identified in the ice core record, it provides a cross-check on the age determined by layer counting.
Both hydrogen peroxide (H2O2) and formaldehyde (HCHO) have been studied, along with organic molecules such as carbon black that are linked to vegetation emissions and forest fires.
For example, there are places in Antarctica where winds evaporate surface ice, concentrating the solids that are left behind, including meteorites.
In the winter of 1908–1909, Church constructed steel tubes with slots and cutting heads to retrieve cores of snow up to 3 m long.
[101] The first systematic study of snow and firn layers was by Ernst Sorge, who was part of the Alfred Wegener Expedition to central Greenland in 1930–1931.
[108] Soviet ice drilling projects began in the 1950s, in Franz Josef Land, the Urals, Novaya Zemlya, and at Mirny and Vostok in the Antarctic; not all these early holes retrieved cores.
EastGRIP reopened for field work in 2022, where the CryoEgg reached new depths in the ice, under pressures in excess of 200 bar and temperatures of around -30c.
Some of these cores reach back to the last glacial period, but they are more important as records of El Niño events and of monsoon seasons in south Asia.
These include plans to:[128] A warming climate is found to create glacial meltwater that washes away temporally ordered layers of trapped aerosols that researchers use as an historical record of environmental events.