Ikeda map
In physics and mathematics, the Ikeda map is a discrete-time dynamical system given by the complex map
The original map was proposed first by Kensuke Ikeda as a model of light going around across a nonlinear optical resonator (ring cavity containing a nonlinear dielectric medium) in a more general form.
It is reduced to the above simplified "normal" form by Ikeda, Daido and Akimoto [1][2]
stands for the electric field inside the resonator at the n-th step of rotation in the resonator, and
are parameters which indicate laser light applied from the outside, and linear phase across the resonator, respectively.
In particular the parameter
is called dissipation parameter characterizing the loss of resonator, and in the limit of
the Ikeda map becomes a conservative map.
The original Ikeda map is often used in another modified form in order to take the saturation effect of nonlinear dielectric medium into account:
A 2D real example of the above form is:
cos
sin
sin
cos
where u is a parameter and
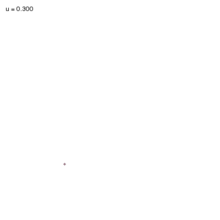
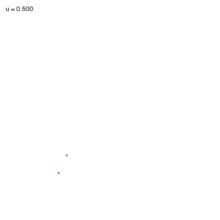
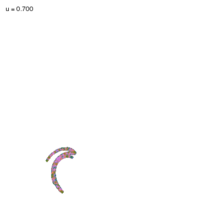
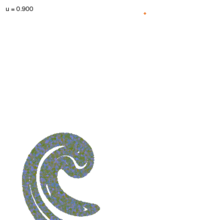
, this system has a chaotic attractor.
This animation shows how the attractor of the system changes as the parameter
is varied from 0.0 to 1.0 in steps of 0.01.
The Ikeda dynamical system is simulated for 500 steps, starting from 20000 randomly placed starting points.
The last 20 points of each trajectory are plotted to depict the attractor.
Note the bifurcation of attractor points as
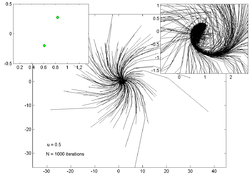
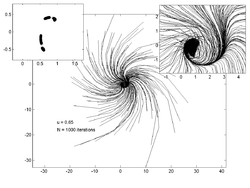
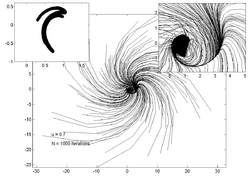
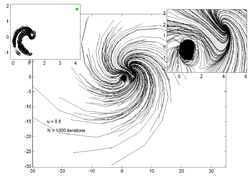
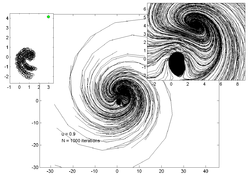
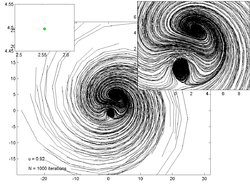
The plots below show trajectories of 200 random points for various values of
The inset plot on the left shows an estimate of the attractor while the inset on the right shows a zoomed in view of the main trajectory plot.
The Octave/MATLAB code to generate these plots is given below: