Household income in the United States
[3] Estimates for previous years are given in terms of real income, which have been adjusted for changes to the price of goods and services.
[7][8] A household's income can be calculated in various ways but the US Census as of 2009 measured it in the following manner: the income of every resident of that house that is over the age of 15, including pre-tax wages and salaries, along with any pre-tax personal business, investment, or other recurring sources of income, as well as any kind of governmental entitlement such as unemployment insurance, social security, disability payments or child support payments received.
[12] The Current Population Survey of the U.S. Census Bureau reported in September 2022 that real median household income was $70,784 in 2021, not statistically different from the 2020 estimate of $71,186.
However, analysis of different working age groups indicate a similar pattern of stagnating median income as well.
[15] Journalist Annie Lowrey wrote in September 2014: "The root causes [of wage stagnation] include technological change, the decline of labor unions, and globalization, economists think, though they disagree sharply on how much to weight each factor.
But foreign-produced goods became sharply cheaper, meaning imports climbed and production moved overseas.
And computers took over for humans in many manufacturing, clerical, and administrative tasks, eroding middle-class jobs growth and suppressing wages.
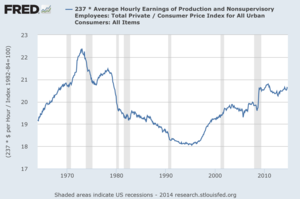
"[16] Measured relative to GDP, total compensation and its component wages and salaries have been declining since 1970.
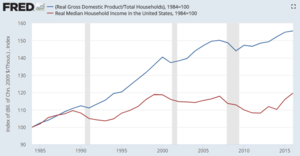
[citation needed] However, as indicated by the charts below, household income has still increased significantly since the late 1970s and early 80s in real terms, partly due to higher individual median wages, and partly due to increased employment of women.
[19] In 2023, annual real median household income grew for the first time since 2019 (before the COVID pandemic) and reached a new high of $80,610.
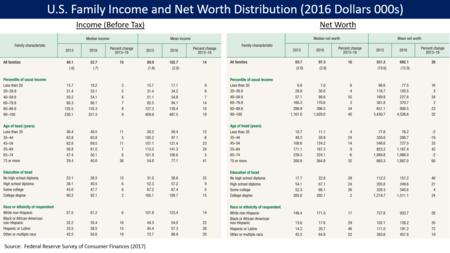
Household income as an economic measure can be represented as a median, a mean, a distribution, and other ways.
As an indicator of economic trends, it may be studied along with related economic measures such as disposable income, debt, household net worth (which includes debt and investments, durable goods like cars and houses), wealth, and employment statistics.
[18] Extreme poverty in the United States, meaning households living on less than $2 per person per day before government benefits, more than doubled in absolute terms from 636,000 to 1.46 million households (including 2.8 million children) between 1996 and 2011, with most of this increase occurring between late 2008 and early 2011.
[24] A 2012 study by the Urban Institute found that 75% of adults in "deep poverty" had not worked in the previous year.
[26] The Census' official definition of money income excludes food stamps and the EITC, for example, while CBO includes it.
[19] While median gross household income showed much stronger growth than depicted by the Census, inequality was shown to still have increased.
Voters can be critical of their government if they perceive that their cost of living is rising faster than their income.
The early-2000s recession began with the bursting of the dot-com bubble and affected most advanced economies including the European Union, Japan and the United States.
The late-2000s recession began with the bursting of the U.S. housing bubble, which caused a problem in the dangerously exposed sub prime-mortgage market.
Overall, the mean household income in the United States, according to the US Census Bureau 2014 Annual Social and Economic Supplement, was $72,641.
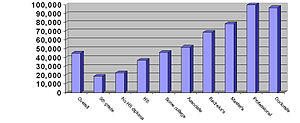
[41] In 2005 graduates with a Master's in Business Administration (MBA) who accepted job offers were expected to earn a base salary of $88,626.
"[42] According to the US Census Bureau persons with doctorates in the United States had an average income of roughly $81,400.
[43][44] Higher educational attainment did not, however, help close the income gap between the genders as the life-time earnings for a male with a professional degree were roughly forty percent (39.59%) higher than those of a female with a professional degree.
The biggest income difference was between those with some college education and those who had a Bachelor's degree, with the latter making $23,874 more annually.
The highest and lowest points of the median household income are presented in bold face.
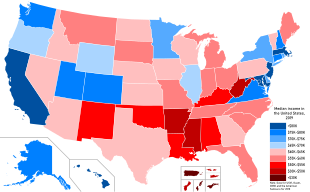
[54][56] When grouped by Census Bureau Region, of the 15 states that, in 2017, had the highest median household income, only Minnesota is located in the Mid-West.
Five are in the Northeast (Connecticut, Massachusetts, New Hampshire, New Jersey and Rhode Island), three are South Atlantic states (Washington D.C., Maryland and Virginia) while the remaining six are in the West (Alaska, California, Colorado, Hawaii, Washington and Utah).
Overall, median household income tended to be the highest in the nation's most urbanized northeastern, upper midwestern and west coast states, while rural areas, mostly in the southern and mountain states (like New Mexico, Montana and Idaho), had the lowest median household income.
Median adjusted personal income per capita varied from $39,901 in Mississippi to $61,601 in Connecticut (and $64,363 in the District of Columbia).
William Thompson and Joseph Hickey[citation needed] see common incomes for the upper class as those exceeding $500,000 with upper middle class incomes ranging from the high 5-figures to most commonly in excess of $100,000.