Intraclass correlation
In statistics, the intraclass correlation, or the intraclass correlation coefficient (ICC),[1] is a descriptive statistic that can be used when quantitative measurements are made on units that are organized into groups.
Consider a data set consisting of N paired data values (xn,1, xn,2), for n = 1, ..., N. The intraclass correlation r originally proposed[2] by Ronald Fisher[3] is where Later versions of this statistic [3] used the degrees of freedom 2N −1 in the denominator for calculating s2 and N −1 in the denominator for calculating r, so that s2 becomes unbiased, and r becomes unbiased if s is known.
The key difference between this ICC and the interclass (Pearson) correlation is that the data are pooled to estimate the mean and variance.
The reason for this is that in the setting where an intraclass correlation is desired, the pairs are considered to be unordered.
The intraclass correlation is also defined for data sets with groups having more than 2 values.
The following equivalent form is simpler to calculate: where K is the number of data values per group, and
[4] The left term is non-negative; consequently the intraclass correlation must satisfy For large K, this ICC is nearly equal to which can be interpreted as the fraction of the total variance that is due to variation between groups.
Ronald Fisher devotes an entire chapter to intraclass correlation in his classic book Statistical Methods for Research Workers.
[3] For data from a population that is completely noise, Fisher's formula produces ICC values that are distributed about 0, i.e. sometimes being negative.
This is because Fisher designed the formula to be unbiased, and therefore its estimates are sometimes overestimates and sometimes underestimates.
For small or 0 underlying values in the population, the ICC calculated from a sample may be negative.
[5] For the model to be identified, the αj and εij are assumed to have expected value zero and to be uncorrelated with each other.
This ICC is always non-negative, allowing it to be interpreted as the proportion of total variance that is "between groups."
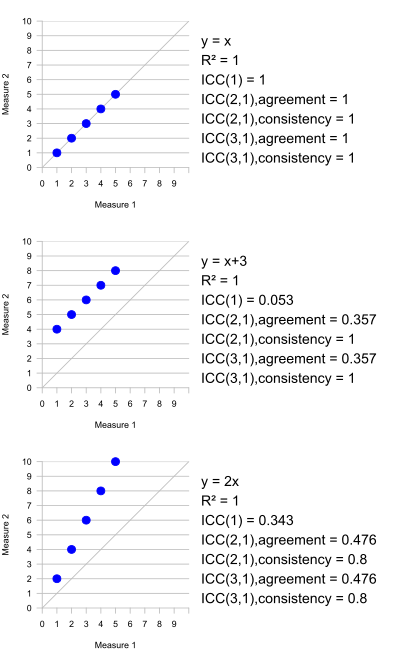
A number of different ICC statistics have been proposed, not all of which estimate the same population parameter.
There has been considerable debate about which ICC statistics are appropriate for a given use, since they may produce markedly different results for the same data.
One key difference between the two statistics is that in the ICC, the data are centered and scaled using a pooled mean and standard deviation, whereas in the Pearson correlation, each variable is centered and scaled by its own mean and standard deviation.
This pooled scaling for the ICC makes sense because all measurements are of the same quantity (albeit on units in different groups).
An important property of the Pearson correlation is that it is invariant to application of separate linear transformations to the two variables being compared.
This property does not make sense for the ICC, since there is no basis for deciding which transformation is applied to each value in a group.
However, if all the data in all groups are subjected to the same linear transformation, the ICC does not change.
Intra-observer variability refers to deviations of a particular observer's score on a particular patient that are not part of a systematic difference.
If the ICC is used in a situation where systematic differences exist, the result is a composite measure of intra-observer and inter-observer variability.
One situation where exchangeability might reasonably be presumed to hold would be where a specimen to be scored, say a blood specimen, is divided into multiple aliquots, and the aliquots are measured separately on the same instrument.
In this case, exchangeability would hold as long as no effect due to the sequence of running the samples was present.
Since the intraclass correlation coefficient gives a composite of intra-observer and inter-observer variability, its results are sometimes considered difficult to interpret when the observers are not exchangeable.
Alternative measures such as Cohen's kappa statistic, the Fleiss kappa, and the concordance correlation coefficient[12] have been proposed as more suitable measures of agreement among non-exchangeable observers.
The rptR package [13] provides methods for the estimation of ICC and repeatabilities for Gaussian, binomial and Poisson distributed data in a mixed-model framework.
Notably, the package allows estimation of adjusted ICC (i.e. controlling for other variables) and computes confidence intervals based on parametric bootstrapping and significances based on the permutation of residuals.
Commercial software also supports ICC, for instance Stata or SPSS[14] The three models are: Number of measurements: Consistency or absolute agreement: The consistency ICC cannot be estimated in the one-way random effects model, as there is no way to separate the inter-rater and residual variances.
An overview and re-analysis of the three models for the single measures ICC, with an alternative recipe for their use, has also been presented by Liljequist et al.