Exploratory factor analysis
EFA is a technique within factor analysis whose overarching goal is to identify the underlying relationships between measured variables.
When developing a scale, researchers should use EFA first before moving on to confirmatory factor analysis (CFA).
[5] EFA requires the researcher to make a number of important decisions about how to conduct the analysis because there is no one set method.
There are several factor analysis fitting methods to choose from, however there is little information on all of their strengths and weaknesses and many don't even have an exact name that is used consistently.
Principal axis factoring (PAF) and maximum likelihood (ML) are two extraction methods that are generally recommended.
In general, ML or PAF give the best results, depending on whether data are normally-distributed or if the assumption of normality has been violated.
[2] The maximum likelihood method has many advantages in that it allows researchers to compute of a wide range of indexes of the goodness of fit of the model, it allows researchers to test the statistical significance of factor loadings, calculate correlations among factors and compute confidence intervals for these parameters.
A downside of PAF is that it provides a limited range of goodness-of-fit indexes compared to ML and does not allow for the computation of confidence intervals and significance tests.
[7] Overfactoring occurs when too many factors are included in a model and may lead researchers to put forward constructs with little theoretical value.
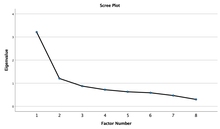
These include Kaiser's (1960) eigenvalue-greater-than-one rule (or K1 rule),[8] Cattell's (1966) scree plot,[9] Revelle and Rocklin's (1979) very simple structure criterion,[10] model comparison techniques,[11] Raiche, Roipel, and Blais's (2006) acceleration factor and optimal coordinates,[12] Velicer's (1976) minimum average partial,[13] Horn's (1965) parallel analysis, and Ruscio and Roche's (2012) comparison data.
[14] Recent simulation studies assessing the robustness of such techniques suggest that the latter five can better assist practitioners to judiciously model data.
With the exception of Revelle and Rocklin's (1979) very simple structure criterion, model comparison techniques, and Velicer's (1976) minimum average partial, all other procedures rely on the analysis of eigenvalues.
The VSS criterion for assessing the extent of replication can take values between 0 and 1, and is a measure of the goodness-of-fit of the factor solution.
There are different methods that can be used to assess model fit:[2] In an attempt to overcome the subjective weakness of Cattell's (1966) scree test,[9][28] presented two families of non-graphical solutions.
The second method, coined the acceleration factor (AF), pertains to a numerical solution for determining the coordinate where the slope of the curve changes most abruptly.
Both the OC and AF methods, generated with the use of Pearson correlation coefficients, were reviewed in Ruscio and Roche's (2012) simulation study.
Results suggested that both techniques performed quite well under ordinal response categories of two to seven (C = 2-7) and quasi-continuous (C = 10 or 20) data situations.
[15] Velicer's (1976) MAP test[13] “involves a complete principal components analysis followed by the examination of a series of matrices of partial correlations” (p. 397).
Although methodologically akin to principal components analysis, the MAP technique has been shown to perform quite well in determining the number of factors to retain in multiple simulation studies.
[14][29] However, in a very small minority of cases MAP may grossly overestimate the number of factors in a dataset for unknown reasons.
In 2012 Ruscio and Roche[14] introduced the comparative data (CD) procedure in an attempt improve to upon the PA method.
The strength of the procedure is its ability to not only incorporate sampling error, but also the factorial structure and multivariate distribution of the items.
In that study, the CD technique, making use of Pearson correlations accurately predicted the correct number of factors 87.14% of the time.
Courtney includes this procedure in his recommended list and gives guidelines showing how it can be easily carried out from within SPSS's user interface.
[34] A review of 60 journal articles by Henson and Roberts (2006) found that none used multiple modern techniques in an attempt to find convergence, such as PA and Velicer's (1976) minimum average partial (MAP) procedures.
A varimax solution yields results which make it as easy as possible to identify each variable with a single factor.
This type of rotation often generates a general factor on which most variables are loaded to a high or medium degree.
However, while exploratory factor analysis is a powerful tool for uncovering underlying structures among variables, it is crucial to avoid reliance on it without adequate theorizing.
For instance, in a hypothetical case study involving the analysis of various physical properties of metals, the results of EFA failed to identify the true underlying factors, instead producing an "over-factored" model that obscured the simplicity of the relationships amongst the observed variables.