Karnaugh map
A Karnaugh map (KM or K-map) is a diagram that can be used to simplify a Boolean algebra expression.
[7] An early advance in the history of formal logic methodology, Karnaugh maps remain relevant in the digital age, especially in the fields of logical circuit design and digital engineering.
[4] A Karnaugh map reduces the need for extensive calculations by taking advantage of humans' pattern-recognition capability.
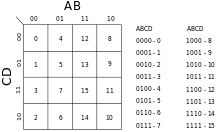
[clarification needed] The required Boolean results are transferred from a truth table onto a two-dimensional grid where, in Karnaugh maps, the cells are ordered in Gray code,[8][4] and each cell position represents one combination of input conditions.
Optimal groups of 1s or 0s are identified, which represent the terms of a canonical form of the logic in the original truth table.
[9] These terms can be used to write a minimal Boolean expression representing the required logic.
Once minimised, canonical sum-of-products and product-of-sums expressions can be implemented directly using AND and OR logic operators.
In the example above, the four input variables can be combined in 16 different ways, so the truth table has 16 rows, and the Karnaugh map has 16 positions.
Gray code ensures that only one variable changes between each pair of adjacent cells.
Each cell of the completed Karnaugh map contains a binary digit representing the function's output for that combination of inputs.
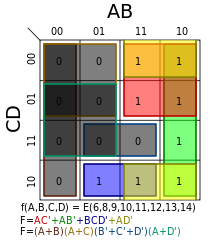
The minterms ('minimal terms') for the final expression are found by encircling groups of 1s in the map.
The grid is toroidally connected, which means that rectangular groups can wrap across the edges (see picture).
Cells on the extreme right are actually 'adjacent' to those on the far left, in the sense that the corresponding input values only differ by one bit; similarly, so are those at the very top and those at the bottom.
[nb 1] The three terms to cover the inverse are all shown with grey boxes with different colored borders: This yields the inverse: Through the use of De Morgan's laws, the product of sums can be determined: Karnaugh maps also allow easier minimizations of functions whose truth tables include "don't care" conditions.
Therefore, "don't care" conditions can either be included in or excluded from any rectangular group, whichever makes it larger.
In this case, the don't care has dropped a term (the green rectangle); simplified another (the red one); and removed the race hazard (removing the yellow term as shown in the following section on race hazards).
The inverse case is simplified as follows: Through the use of De Morgan's laws, the product of sums can be determined: Karnaugh maps are useful for detecting and eliminating race conditions.
However, because of the nature of Gray coding, adjacent has a special definition explained above – we're in fact moving on a torus, rather than a rectangle, wrapping around the top, bottom, and the sides.
would eliminate the potential race hazard, bridging between the green and blue output states or blue and red output states: this is shown as the yellow region (which wraps around from the bottom to the top of the right half) in the adjacent diagram.
Applying De Morgan's laws creates another product of sums expression for f, but with a new factor of