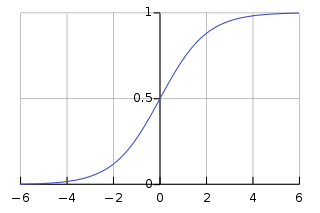
Logistic function
[3][4] The logistic function finds applications in a range of fields, including biology (especially ecology), biomathematics, chemistry, demography, economics, geoscience, mathematical psychology, probability, sociology, political science, linguistics, statistics, and artificial neural networks.
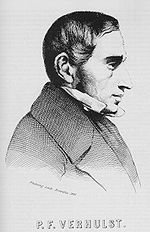
Verhulst did not explain the choice of the term "logistic" (French: logistique), but it is presumably in contrast to the logarithmic curve,[8][b] and by analogy with arithmetic and geometric.
The unique standard logistic function is the solution of the simple first-order non-linear ordinary differential equation
Note that the reciprocal logistic function is solution to a simple first-order linear ordinary differential equation.
The equation was rediscovered in 1911 by A. G. McKendrick for the growth of bacteria in broth and experimentally tested using a technique for nonlinear parameter estimation.
In particular, the Rasch model forms a basis for maximum likelihood estimation of the locations of objects or persons on a continuum, based on collections of categorical data, for example the abilities of persons on a continuum based on responses that have been categorized as correct and incorrect.
Logistic functions are often used in artificial neural networks to introduce nonlinearity in the model or to clamp signals to within a specified interval.
A common choice for the activation or "squashing" functions, used to clip large magnitudes to keep the response of the neural network bounded,[18] is
Practitioners caution that sigmoidal functions which are antisymmetric about the origin (e.g. the hyperbolic tangent) lead to faster convergence when training networks with backpropagation.
This application can be considered an extension of the above-mentioned use in the framework of ecology (see also the Generalized logistic curve, allowing for more parameters).
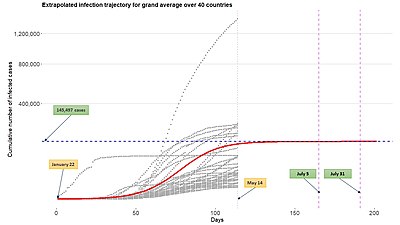
A novel infectious pathogen to which a population has no immunity will generally spread exponentially in the early stages, while the supply of susceptible individuals is plentiful.
[20] Factors including a lack of susceptible hosts (through the continued spread of infection until it passes the threshold for herd immunity) or reduction in the accessibility of potential hosts through physical distancing measures, may result in exponential-looking epidemic curves first linearizing (replicating the "logarithmic" to "logistic" transition first noted by Pierre-François Verhulst, as noted above) and then reaching a maximal limit.
[22][23][24] A generalized logistic function, also called the Richards growth curve, has been applied to model the early phase of the COVID-19 outbreak.
The logistic function determines the statistical distribution of fermions over the energy states of a system in thermal equilibrium.
Under certain conditions, such as the presence of a temperature or concentration gradient due to diffusion and balancing with gravity, logistic curve behaviours can emerge.
In linguistics, the logistic function can be used to model language change:[29] an innovation that is at first marginal begins to spread more quickly with time, and then more slowly as it becomes more universally adopted.
In particular, Tarde identifies three main stages through which innovations spread: the first one corresponds to the difficult beginnings, during which the idea has to struggle within a hostile environment full of opposing habits and beliefs; the second one corresponds to the properly exponential take-off of the idea, with
However, this funding source is usually subject to strict legal rules as well as to economy scarcity constraints, especially the resources the banks can lend (due to their equity or Basel limits).
These restrictions, which represent a saturation level, along with an exponential rush in an economic competition for money, create a public finance diffusion of credit pleas and the aggregate national response is a sigmoid curve.
[32] Historically, when new products are introduced there is an intense amount of research and development which leads to dramatic improvements in quality and reductions in cost.
Some of the more famous examples are: railroads, incandescent light bulbs, electrification, cars and air travel.
Eventually, dramatic improvement and cost reduction opportunities are exhausted, the product or process are in widespread use with few remaining potential new customers, and markets become saturated.
These papers deal with the diffusion of various innovations, infrastructures and energy source substitutions and the role of work in the economy as well as with the long economic cycle.
[36] Carlota Perez used a logistic curve to illustrate the long (Kondratiev) business cycle with the following labels: beginning of a technological era as irruption, the ascent as frenzy, the rapid build out as synergy and the completion as maturity.
Under these conditions, estimating the height at which the inflection point will occur may have uncertainties comparable to the carrying capacity (K) of the system.
A method to mitigate this uncertainty involves using the carrying capacity from a surrogate logistic growth process as a reference point.
[38] By incorporating this constraint, even if K is only an estimate within a factor of two, the regression is stabilized, which improves accuracy and reduces uncertainty in the prediction parameters.
This approach can be applied in fields such as economics and biology, where analogous surrogate systems or populations are available to inform the analysis.
Link[39] created an extension of Wald's theory of sequential analysis to a distribution-free accumulation of random variables until either a positive or negative bound is first equaled or exceeded.
Link[41] provides a century of examples of "logistic" experimental results and a newly derived relation between this probability and the time of absorption at the boundaries.