Main sequence
In astronomy, the main sequence is a classification of stars which appear on plots of stellar color versus brightness as a continuous and distinctive band.
After condensation and ignition of a star, it generates thermal energy in its dense core region through nuclear fusion of hydrogen into helium.
During this stage of the star's lifetime, it is located on the main sequence at a position determined primarily by its mass but also based on its chemical composition and age.
The main sequence is sometimes divided into upper and lower parts, based on the dominant process that a star uses to generate energy.
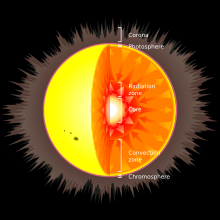
Main-sequence stars with more than two solar masses undergo convection in their core regions, which acts to stir up the newly created helium and maintain the proportion of fuel needed for fusion to occur.
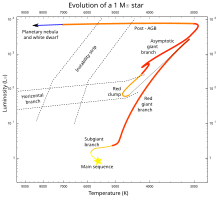
After the hydrogen fuel at the core has been consumed, the star evolves away from the main sequence on the HR diagram, into a supergiant, red giant, or directly to a white dwarf.
The Harvard classification had been developed by assigning a different letter to each star based on the strength of the hydrogen spectral line before the relationship between spectra and temperature was known.
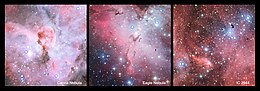
[8][9] When a protostar is formed from the collapse of a giant molecular cloud of gas and dust in the local interstellar medium, the initial composition is homogeneous throughout, consisting of about 70% hydrogen, 28% helium, and trace amounts of other elements, by mass.
Once sufficiently dense, stars begin converting hydrogen into helium and giving off energy through an exothermic nuclear fusion process.
[14][15] The ZAMS curve can be calculated using computer models of stellar properties at the point when stars begin hydrogen fusion.
A key indicator of this energy distribution is given by the color index, B − V, which measures the star's magnitude in blue (B) and green-yellow (V) light by means of filters.
[22] By treating the star as an idealized energy radiator known as a black body, the luminosity L and radius R can be related to the effective temperature Teff by the Stefan–Boltzmann law: where σ is the Stefan–Boltzmann constant.
The ratio of M to R increases by a factor of only three over 2.5 orders of magnitude of M. This relation is roughly proportional to the star's inner temperature TI, and its extremely slow increase reflects the fact that the rate of energy generation in the core strongly depends on this temperature, whereas it has to fit the mass-luminosity relation.
A reduction of energy production would cause the overlaying mass to compress the core, resulting in an increase in the fusion rate because of higher temperature and pressure.
Astronomers divide the main sequence into upper and lower parts, based on which of the two is the dominant fusion process.
In the lower main sequence, energy is primarily generated as the result of the proton–proton chain, which directly fuses hydrogen together in a series of stages to produce helium.
[31] Stars in the upper main sequence have sufficiently high core temperatures to efficiently use the CNO cycle (see chart).
At a stellar core temperature of 18 million kelvin, the PP process and CNO cycle are equally efficient, and each type generates half of the star's net luminosity.
Convection is a more efficient mode for carrying energy than radiation, but it will only occur under conditions that create a steep temperature gradient.
[30][37] In massive stars (above 10 M☉)[38] the rate of energy generation by the CNO cycle is very sensitive to temperature, so the fusion is highly concentrated at the core.
[31] This mixing of material around the core removes the helium ash from the hydrogen-burning region, allowing more of the hydrogen in the star to be consumed during the main-sequence lifetime.
However, even perfect observation would show a fuzzy main sequence because mass is not the only parameter that affects a star's color and luminosity.
As an example, there are metal-poor stars (with a very low abundance of elements with higher atomic numbers than helium) that lie just below the main sequence and are known as subdwarfs.
These stars are fusing hydrogen in their cores and so they mark the lower edge of the main sequence fuzziness caused by variance in chemical composition.
The strip intersects the upper part of the main sequence in the region of class A and F stars, which are between one and two solar masses.
[47] For a star with at least 0.5 M☉, when the hydrogen supply in its core is exhausted and it expands to become a red giant, it can start to fuse helium atoms to form carbon.
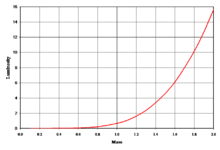
Although more massive stars have more fuel to burn and might intuitively be expected to last longer, they also radiate a proportionately greater amount with increased mass.
By contrast, a lower opacity means energy escapes more rapidly and the star must burn more fuel to remain in equilibrium.
[56] A sufficiently high opacity can result in energy transport via convection, which changes the conditions needed to remain in equilibrium.
[59][60] The most massive stars do not become red giants; instead, their cores quickly become hot enough to fuse helium and eventually heavier elements and they are known as supergiants.