Majority minority
For example, a study of the 2006 European Social Survey found that people of localized majority-minority status across 21 EU countries were more supportive of stronger political European integration than existing national native majorities,[2] and a 2019 Pew Research Center study found that 46 percent of white Americans believed national majority-minority demography would negatively impact American culture.
In research funded by the EU's Framework Programmes, a 2015 study explored this difference, finding that, for example, ethnic Austrians living in South Tyrol manifest a culture which tends to oblige ethnic Italians to learn the German language for advancement in the province, such as access to the administration of local government.
[8] In the Netherlands, majority-minority schools emerged in the post-war period, starting as a phenomenon in Amsterdam with immigration from Surinam and from Curaçao, right after World War II.
[11] Since the late 20th century, areas of Northern and Western Europe have been undergoing demographic transformation resulting in majority minority cities.
[12] A 2018 study in Frontiers in Psychology analyzed:[13] In the United States and Canada racial minorities already comprise a larger share of the population than Whites in dozens of major cities (e.g., Vancouver and New York).
[17] According to a study at the European Commission's research repository CORDIS:[18] In cities like Amsterdam, now only one in three youngsters under age fifteen is of native descent.
This situation, referred to as a majority-minority context, is a new phenomenon in Western Europe and it presents itself as one of the most important societal and psychological transformations of our time.In the course of two generations places in Northwestern Europe, such as Amsterdam and Brussels, have become majority minority, with ethnic Dutch, Flemings and Walloons, respectively, representing less than 50 percent of the population of the capitals.
"[19] Demographers Dudley L. Poston Jr. and Rogelio Sáenz have noted how "nonwhites account for more than half of the populations of Hawaii, the District of Columbia, California, New Mexico, Texas and Nevada.
A multitude of scholars have designated countries, or sovereign states, particularly in the developed or Western world, which are projected to obtain majority-minority demography between 2040 and 2050.
This includes the United States, Canada and New Zealand, with Australia, and nations in Western Europe, estimated to follow this trend toward the end of the century.
[25] There are multiple axis points of difference, and distinction, between groupings of people that can contribute towards the attribution of majority-minority status upon a particular area or within a societal scenario.
[26] Where religion does not significantly influence designations of majority minority labels, certain cultural and linguistic differences may be emphasized in that particular society, such as in South Tyrol.
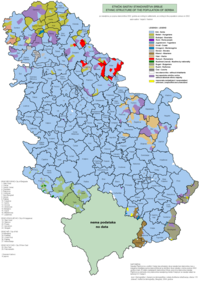
[27] Kosovo has a history of being a majority-minority area via the historic borders of Serbia in the 20th century, and prior to its independence declaration.
[28] When majority minority status is designated or predicted in terms of racial groups, many scholarly and journalistic works make this distinction with reference to white people.
[29] Based upon nation-based racial classifications, academics Eric Kaufmann and Matthew Goodwin have suggested that white people will be minorities in the United States, Canada and New Zealand, in what they define as "the ‘majority-minority’ point", by approximately 2050.
Majority-minority municipalities by province, and percentage of non-European population:[89] British Columbia Alberta Saskatchewan Manitoba Ontario Quebec In the United States of America, majority-minority area or minority-majority area is a term describing a U.S. state or jurisdiction whose population is composed of less than 50% non-Hispanic whites.
English Australians make up the largest single ethnic group by ancestry, being reported by 36.1% of the population in the 2016 census.
The Black minority did not enlarge its representation in the population to more than 1.5% in the period, while it was mostly the growth in the number of pardo people (~38% in 2000, 42.4% in 2010) that caused the demographic plurality of Brazil.