Stock market crash
Likewise, the bursting of the Japanese asset price bubble occurred over several years without any notable crashes.
It was a technological golden age, as innovations such as the radio, automobile, aviation, telephone, and the electric power transmission grid were deployed and adopted.
Companies that had pioneered these advances, including Radio Corporation of America (RCA) and General Motors, saw their stocks soar.
By the summer of 1929, it was clear that the economy was contracting, and the stock market went through a series of unsettling price declines.
The deluge of selling overwhelmed the ticker tape system that normally gave investors the current prices of their shares.
Forced to liquidate their stocks because of margin calls, overextended investors flooded the exchange with sell orders.
The markets rallied in succeeding months, but it was a temporary recovery that led unsuspecting investors into further losses.
The crash was followed by the Great Depression, the worst economic crisis of modern times, which plagued the stock market and Wall Street throughout the 1930s.
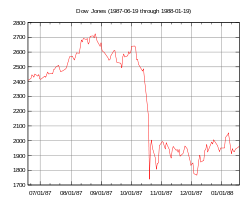
The crash was the greatest single-day loss that Wall Street had ever suffered in continuous trading up to that point.
[11] Despite fears of a repeat of the Great Depression, the market rallied immediately after the crash, posting a record one-day gain of 102.27 the very next day and 186.64 points on Thursday, October 22.
It took only two years for the Dow to recover completely; by September 1989, the market had regained all of the value it had lost in the 1987 crash.
[12] Herd behavior and psychological feedback loops play a critical part in all stock market crashes but analysts have also tried to look for external triggering events.
Aside from the general worries of stock market overvaluation, blame for the collapse has been apportioned to such factors as program trading, portfolio insurance and derivatives, and prior news of worsening economic indicators (i.e. a large U.S. merchandise trade deficit and a falling U.S. dollar, which seemed to imply future interest rate hikes).
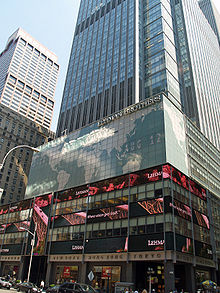
On September 15, 2008, the bankruptcy of Lehman Brothers and the collapse of Merrill Lynch along with a liquidity crisis of American International Group, all primarily due to exposure to packaged subprime loans and credit default swaps issued to insure these loans and their issuers, rapidly devolved into a global crisis.
This resulted in several bank failures in Europe and sharp reductions in the value of stocks and commodities worldwide.
The Times of London reported that the meltdown was being called the Crash of 2008, and older traders were comparing it with Black Monday in 1987.
On October 24, 2008, many of the world's stock exchanges experienced the worst declines in their history, with drops of around 10% in most indices.
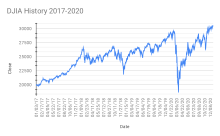
On Monday, March 9, 2020, after the launch of the 2020 Russia–Saudi Arabia oil price war, the FTSE and other major European stock market indices fell by nearly 8%.
[26] On March 12, 2020, a day after US President Donald Trump announced a travel ban from Europe, stock prices again fell sharply.
[citation needed] In June 2020 the Nasdaq surpassed its pre-crash high followed by the S&P 500 in August and the Dow in November.
[31] Mandelbrot observed that large movements in prices (i.e. crashes) are much more common than would be predicted from a log-normal distribution.
Mandelbrot and others suggested that the nature of market moves is generally much better explained using non-linear analysis and concepts of chaos theory.
[32] This has been expressed in non-mathematical terms by George Soros in his discussions of what he calls reflexivity of markets and their non-linear movement.
[34][35] Research at the Massachusetts Institute of Technology suggests that there is evidence that the frequency of stock market crashes follows an inverse cubic power law.
[37] In 1963, Mandelbrot proposed that instead of following a strict random walk, stock price variations executed a Lévy flight.
In 1995, Rosario Mantegna and Gene Stanley analyzed a million records of the S&P 500 Index, calculating the returns over a five-year period.
[39] Researchers continue to study this theory, particularly using computer simulation of crowd behavior, and the applicability of models to reproduce crash-like phenomena.
This work is a mathematical demonstration of a significant advance warning sign of impending market crashes.
Since their inception after Black Monday (1987), trading curbs have been modified to prevent both speculative gains and dramatic losses within a small time frame.