Martin curve
The Martin curve is a power law used by oceanographers to describe the export to the ocean floor of particulate organic carbon (POC).
[17][18][12][19][20][21][22][6] However, the Martin curve has become ubiquitous as the model that assumes slower-sinking and/or labile organic matter is preferentially depleted near the surface causing increasing sinking speed and/or remineralization timescale with depth.
[10][23] The Martin curve can be expressed in a slightly more general way as:[24] where fp(z) is the fraction of the flux of particulate organic matter from a productive layer near the surface [25] sinking through the depth horizon z [m], Cp [mb] is a scaling coefficient, and b is a nondimensional exponent controlling how fp decreases with depth.
Because POC is labile and has little negative buoyancy, it must be aggregated with relatively heavy materials called ballast to settle gravitationally in the ocean.
In 1993, Ittekkot hypothesized that the drastic decrease from ~280 to ~200 ppm of atmospheric CO2 that occurred during the last glacial maximum was caused by an increase of the input of aeolian dust (aluminosilicate ballast) to the ocean, which strengthened the BCP.
[26] In 2002, Klaas and Archer , as well as Francois et al. who compiled and analyzed global sediment trap data, suggested that CaCO3, which has the largest density among possible ballast minerals, is globally the most important and effective facilitator of vertical POC transport, because the transfer efficiency (the ratio of the POC flux in the deep sea to that at the bottom of the surface mixed layer) is higher in subtropical and tropical areas where CaCO3 is a major component of marine snow.
[28][33][5] On the basis of observations that revealed a large increase of POC fluxes in high-latitude areas during diatom blooms and on the fact that diatoms are much bigger than coccolithophores,[35][36][37] Honda and Watanabe proposed in 2010 that opal, rather than CaCO3, is crucial as ballast for effective POC vertical transport in subarctic regions.
[40][5] Using radiochemical observations (234Th-based POC flux observations), Pavia et al. found in 2019 that the exponent b of the Martin curve was significantly smaller in the low-oxygen (hypoxic) eastern Pacific equatorial zone than in other areas; that is, vertical attenuation of the POC flux was smaller in the hypoxic area.
[44] They pointed out that a more hypoxic ocean in the future would lead to a lower attenuation of the POC flux and therefore increased BCP efficiency and could thereby be a negative feedback on global warming.
[44] McDonnell et al. reported in 2015 that vertical transport of POC is more effective in the Antarctic, where the sinking velocity is higher and the biological respiration rate is lower than in the subtropical Atlantic.
In 2021, Lauderdale evaluated structural uncertainty using an ocean biogeochemistry model by systematically substituting six alternative remineralisation profiles fit to a reference power-law curve.
[24][48] Carbon and nutrients are consumed by phytoplankton in the surface ocean during primary production, leading to a downward flux of organic matter.
This "marine snow" is transformed, respired, and degraded by heterotrophic organisms in deeper waters, ultimately releasing those constituents back into dissolved inorganic form.
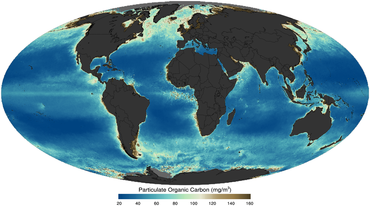
as imaged by satellite in 2011


