Meteorological history of Hurricane Katrina
Hurricane Katrina was a devastating tropical cyclone that had a long and complex meteorological history, spanning a month from August 8, 2005 to September 7, 2005.
Subsequent interaction with the trough spurred convective development, resulting in the formation of Tropical Depression Twelve over the Bahamas on August 23.
The flat terrain of the Everglades did little to disrupt the core of Katrina, only leading to slight weakening before the cyclone emerged over the Gulf of Mexico.
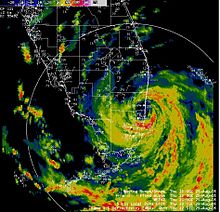
Its maximum sustained winds reached 175 mph (280 km/h) and its pressure fell to 902 mbar (hPa; 26.63 inHg), ranking it among the strongest ever recorded in the Gulf of Mexico.
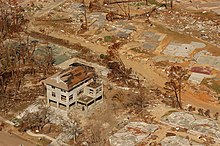
Katrina struck southeastern Louisiana on August 29 as a Category 3 hurricane, resulting in one of the greatest catastrophes in modern times in the United States.
[4] As the hurricane moved inland it quickly weakened, degrading below tropical storm strength over the Ohio River Valley on August 30.
Strong wind shear produced by an upper tropospheric trough over the western Atlantic caused the depression to quickly degrade into a remnant low as it progressed west-northwest.
[6] During operational analyses by the National Hurricane Center (NHC), there was uncertainty over the degree of involvement of the remnants of Ten with the eventual formation of Katrina; however, thorough analysis determined them to be two separate systems.
This spurred further cyclogenesis and the disturbance finally became Tropical Depression Twelve around 12:00 UTC on August 23 while located about 200 mi (325 km) southeast of Nassau.
[5] During its nascent stages, Tropical Depression Twelve moved slowly northwest in response to a subtropical ridge over the central Atlantic.
Based on aircraft reconnaissance data, the NHC assessed the depression to have intensified into a tropical storm over the central Bahamas by 12:00 UTC on August 23.
[15][19] An increase in wind shear kept the storm's structure asymmetric, pushing dry air into its circulation, with the strongest convection displaced to the south and east,[15][19] but did not become strong enough to significantly disrupt it.
[26] While traversing Monroe County, Katrina briefly weakened to a tropical storm before emerging over the Gulf of Mexico around 05:00 UTC on August 26.
[15] The Dry Tortugas observed sustained hurricane-force winds, with a peak gust of 105 mph (169 km/h),[25] late in the day as Katrina moved toward the central Gulf.
[25] During this cycle, Katrina's overall size expanded dramatically, nearly doubling by the end of the day, with tropical storm-force winds extended up to 160 mi (260 km) from its center.
[37] The ridge that previously kept the hurricane on a west-southwest trajectory shifted east, causing Katrina to turn due west and later west-northwest on August 28.
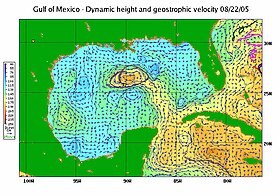
[31] This took the hurricane over the Gulf of Mexico's OHC maximum—OHC values reached 123 kJ cm–2 and sea temperatures of 79 °F (26 °C) extended to a depth of 360 ft (110 m)[12]: 340 [30]—providing ample fuel for intensification.
[41] Katrina reached its peak intensity with maximum sustained winds of 175 mph (280 km/h) and a central pressure of 902 mbar (hPa; 26.63 inHg) around 18:00 UTC.
Katrina's estimated intensity was primarily based on this observation, with a 90 percent rule of thumb reduction used to calibrate for surface-level equivalence.
[44] A study by Edward Rappaport et al. published in Weather and Forecasting in 2010 indicated that large hurricanes, especially intense ones, in the Gulf of Mexico often weaken significantly before landfall.
Based on analysis of aircraft reconnaissance data, the NHC estimated Katrina to have moved ashore with maximum winds of 125 mph (205 km/h) and a central pressure of 920 mbar (hPa; 27.17 inHg).
[50] On August 26, it became clear to forecasters at the NHC that Katrina was tracking significantly more west of the originally expected landfall in the Florida Panhandle.
Four- to five-day errors were slightly larger than the shorter-term overall; however, this was largely related to the west-southwest track shift across the Florida Panhandle rather than Katrina's path in the days leading up to landfall along the Gulf Coast.
Though the total destruction of buildings and infrastructure in coastal communities made post-storm assessments of surge heights difficult, a maximum high water mark of 27.8 ft (8.5 m) was found in Pass Christian.
[59][60][61] A 2014 study published in Earth Interactions showed strong correlation between the radius of a system's storm- and hurricane-force winds 18 hours before landfall and storm surge heights.
[65] Most of the tornadoes occurred in the hurricane's right-front quadrant, where strong low-level wind shear, high moisture content, and low convective available potential energy combined to produce locally favorable tornadic conditions.
[68] Strong westerly shear produced by the trough caused Katrina's upper-level anticyclone to break east away from the low-level circulation on August 30.
This led to the separation of the storm's low-level warm core which continued northeast and almost instantaneously transitioned into an extratropical cyclone that day as colder air wrapped in from the northwest.
[69] The NHC assessed Katrina's dissipation as a distinct entity by 12:00 UTC on August 31 as it was absorbed into the aforementioned trough over central Ohio.
[3] The anticyclone that separated from Katrina on August 30 in conjunction with the frontal boundary that the hurricane merged with had expansive impacts on weather across the Northern Hemisphere over the next two weeks.