Quantum graph
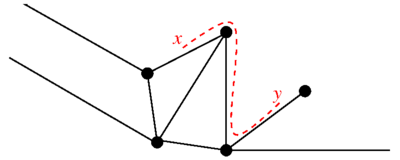
An example would be a power network consisting of power lines (edges) connected at transformer stations (vertices); the differential equations would then describe the voltage along each of the lines, with boundary conditions for each edge provided at the adjacent vertices ensuring that the current added over all edges adds to zero at each vertex.
Quantum graphs were first studied by Linus Pauling as models of free electrons in organic molecules in the 1930s.
They also arise in a variety of mathematical contexts,[1] e.g. as model systems in quantum chaos, in the study of waveguides, in photonic crystals and in Anderson localization, or as a limit on shrinking thin wires.
Quantum graphs have become prominent models in mesoscopic physics used to obtain a theoretical understanding of nanotechnology.
Another, more simple notion of quantum graphs was introduced by Freedman et al.[2] Aside from actually solving the differential equations posed on a quantum graph for purposes of concrete applications, typical questions that arise are those of controllability (what inputs have to be provided to bring the system into a desired state, for example providing sufficient power to all houses on a power network) and identifiability (how and where one has to measure something to obtain a complete picture of the state of the system, for example measuring the pressure of a water pipe network to determine whether or not there is a leaking pipe).
The choice of which vertex lies at zero is arbitrary with the alternative corresponding to a change of coordinate on the edge.
of functions on the edges of the graph and specifying matching conditions at the vertices.
The Dirichlet conditions don't allow interaction between the intervals so the spectrum is the same as that of the set of disconnected edges.
in the domain of the operator is continuous everywhere on the graph and the sum of the outgoing derivatives at a vertex is zero, where
All self-adjoint matching conditions of the Laplace operator on a graph can be classified according to a scheme of Kostrykin and Schrader.
In practice, it is often more convenient to adopt a formalism introduced by Kuchment, see,[3] which automatically yields an operator in variational form.
through the linear equation, The matching conditions define a self-adjoint operator if
The spectrum of the Laplace operator on a finite graph can be conveniently described using a scattering matrix approach introduced by Kottos and Smilansky .
However, for a large class of matching conditions the S-matrix is independent of
is called the bond scattering matrix and can be thought of as a quantum evolution operator on the graph.
is the phase acquired by the plane wave when propagating from vertex
In 1997 Kottos and Smilansky used the quantization condition above to obtain the following trace formula for the Laplace operator on a graph when the transition amplitudes are independent of
The trace formula links the spectrum with periodic orbits on the graph.
is the mean separation of eigenvalues and the oscillating part is a sum over all periodic orbits
is the product of the transition amplitudes at the vertices of the graph around the orbit.
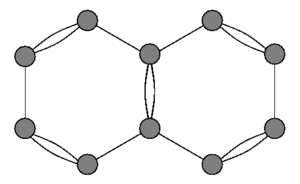
Quantum graphs were first employed in the 1930s to model the spectrum of free electrons in organic molecules like Naphthalene, see figure.
As a first approximation the atoms are taken to be vertices while the σ-electrons form bonds that fix a frame in the shape of the molecule on which the free electrons are confined.
A quantum waveguide can be thought of as a fattened graph where the edges are thin tubes.
Understanding mesoscopic systems plays an important role in the field of nanotechnology.
Classical motion on the graph can be defined as a probabilistic Markov chain where the probability of scattering from edge
is given by the absolute value of the quantum transition amplitude squared,
For almost all finite connected quantum graphs the probabilistic dynamics is ergodic and mixing, in other words chaotic.
Quantum graphs embedded in two or three dimensions appear in the study of photonic crystals.
[7] In two dimensions a simple model of a photonic crystal consists of polygonal cells of a dense dielectric with narrow interfaces between the cells filled with air.
are common models of periodic systems and quantum graphs have been applied to the study the phenomena of Anderson localization where localized states occur at the edge of spectral bands in the presence of disorder.