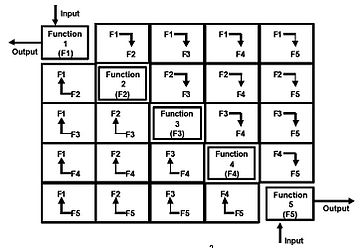
N2 chart
It is used to systematically identify, define, tabulate, design, and analyze functional and physical interfaces.
The system functions are placed on the diagonal; the remainder of the squares in the N × N matrix represent the interface inputs and outputs.
Alternatively, the use of circles and numbers permits a separate listing of the data interfaces.
A simple flow of interface data exists between the upper and lower modules at functions F7 and F8.
In addition to defining the data that must be supplied across the interface, the N2 chart can pinpoint areas where conflicts could arise.
This N × N matrix requires the user to generate complete definitions of all interfaces in a rigid bidirectional, fixed framework.
The user places the functional or physical entities on the diagonal axis and the interface inputs and outputs in the remainder of the diagram squares.
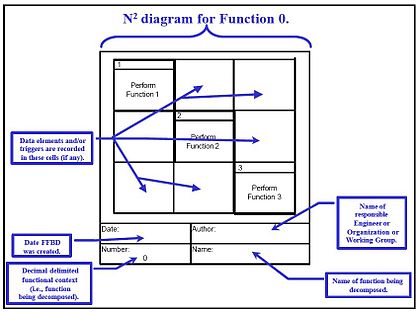
Each N2 diagram shall contain at a minimum the following contextual and administrative data: N2 diagrams are a valuable tool for not only identifying functional or physical interfaces, but also for pinpointing areas in which conflicts may arise with interfaces so that system integration proceeds smoothly and efficiently.