NM-method
The NM-method or Naszodi–Mendonca method is the operation that can be applied in statistics, econometrics, economics, sociology, and demography to construct counterfactual contingency tables.
called the seed table) in the sense of being ranked the same but with the row and column totals of a target matrix
The NM-method is consistent with a definition relying on the ordinal Liu-Lu index [3] which is the slightly modified version of the Coleman-index defined by Eq.
Than, equating the original, scalar-valued Liu-Lu indices of the 2×2 matrices obtained with the dichotomizations.
) by applying the formula of the original scalar-valued Liu-Lu index to each of the 9 matrices: Apparently, matrix
) by applying the formula of the original scalar-valued Liu-Lu index to each of the 4 matrices: Apparently, matrix
represent joint distributions of one-to-one matched entities (e.g. husbands and wives, or first born children and mothers, or dwellings and main tenants, or CEOs and companies, or chess instructors and their most talended students) characterized either by a dichotomous categorical variable (e.g. taking values vegetarian/non-vegetarian, Grandmaster/or not), or an ordered multinomial categorical variable (e.g. level of final educational attainment, skiers' ability level, income bracket, category of rental fee, credit rating, FIDE titles).
Although the NM-method has a wide range of applicability, all the examples to be presented next are about assortative mating along the education level.
In these applications, the two preconditions (of ordered trait variable, and positive assortative mating in all educational groups) are not debated to be met.
characterizes the joint educational distribution of husbands and wives in Zimbabwe, while matrix
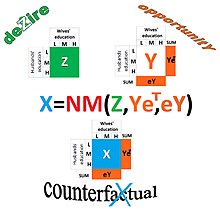
to be constructed with the NM-method tells us what would be the joint educational distribution of couples in Zimbabwe, if the educational distributions of husbands and wives were the same as in Yemen, while the overall desire for homogamy (also called as aggregate marital preferences in economics, or marital matching social norms/social barriers in sociology) were unchanged.
is the joint educational distribution of American newlyweds in 2040, where the husbands are from Generation Z and being young adults when observed.
, one can study in the future what would be the educational distribution among the just married American young couples if they sorted into marriages the same way as the males in Generation Z and their partners do, while the education level were the same as among the males in Generation Y and their partners.
is the joint educational distribution of Portuguese young couples (where the male partners' age is between 30 and 34 years) in 2011.
is used to calculate the contribution of each of the driving forces (i.e., the observed structural availability of potential partners with various education levels determining the opportunities at the population level; and the unobservable non-structural drivers, e.g., aggregate matching preferences, desires, norms, barriers) and that of their interaction (i.e., the effect of changes in aggregate preferences/desires/norms/barriers due to changes in structural availability) to an observable cardinal scaled statistics (e.g. the share of educationally homogamous couples).
[5] In this respect, the NM-method is similar to the linear probability model that signals the same with a predicted probabiity outside the unit interval
The IPF defines closeness of matrices of the same size by the cross-entropy, or the Kullback-Leibler divergence.
characterize two different populations (either observed simultaneously like in the application for Zimbabwe and Yemen, or observed in two different points in time like in its application for the populations of Generation Z and Generation Y).
[12] Deming and Stephan(1940),[13] the inventors of the IPF, illustrated the application of their method on a classic maximum likelihood estimation problem, where matrix
Second, unlike the IPF, the NM-method does not provide a meaningful solution for pairs of matrices
[15] For this reason, the transformed table obtained with the IPF can be sensitive to the choice of the number of trait categories.
Kenneth Macdonald (2023)[16] is at ease with the conclusion by Naszodi (2023)[17] that the IPF is suitable for sampling correction tasks, but not for generation of counterfactuals.
Similarly to Naszodi, Macdonald also questions whether the row and column proportional transformations of the IPF preserve the structure of association within a contingency table that allows us to study social mobility.
The Minimum Euclidean Distance Approach (MEDA) (defined by Abbott et al., 2019 following Fernández and Rogerson, 2001) is also a function:[18] [19]
: it is the weight used for constructing the convex combination of two extreme cases (random and perfectly assortative matching with the pair of marginals
) the MEDA constructs the convex combination of the two extreme cases (random and perfectly assortative matches with the pair of marginals (
matrices larger than 2×2, the generalized Liu-Lu index is matrix-valued, so it is different from the scalar-valued
For instance, in the numerical example taken from Abbott et al.(2019), the counterfactual table constructed by MEDA is the matrix
E.g. the share of homogamous couples is 2 percentage points smaller in the MEDA-constructed counterfactual matrix
Because Abbott's example is not a fictional one, but is based on the empirical educational distribution of American couples, therefore the difference between 2 percentage points and 3.4 percentage points can be interpreted as the MEDA quantifies changes in inequality from one generation to another generation to be significantly smaller compared to the NM.