Network science
The field draws on theories and methods including graph theory from mathematics, statistical mechanics from physics, data mining and information visualization from computer science, inferential modeling from statistics, and social structure from sociology.
"[1] The study of networks has emerged in diverse disciplines as a means of analyzing complex relational data.
Such scale-free networks have unexpected structural and dynamical properties, rooted in the diverging second moment of the degree distribution.
The Erdős–Rényi model, named for Paul Erdős and Alfréd Rényi, is used for generating random graphs in which edges are set between nodes with equal probabilities.
Because the model is generated without bias to particular nodes, the degree distribution is binomial: for a randomly chosen vertex
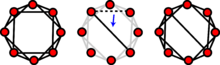
As the rewiring probability increases, the clustering coefficient decreases slower than the average path length.
Higher values of p force more rewired edges, which, in effect, makes the Watts–Strogatz model a random network.
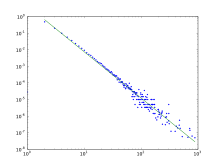
The degree distribution resulting from the BA model is scale free, in particular, for large degree it is a power law of the form: Hubs exhibit high betweenness centrality which allows short paths to exist between nodes.
It implies that the higher the links (degree) a node has, the higher its chance of gaining more links since they can be reached in a larger number of ways through mediators which essentially embodies the intuitive idea of rich get richer mechanism (or the preferential attachment rule of the Barabasi–Albert model).
Another model where the key ingredient is the nature of the vertex has been introduced by Caldarelli et al.[32] Here a link is created between two vertices
Such model has been successfully applied to describe trade between nations by using GDP as fitness for the various nodes
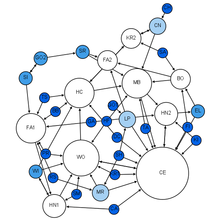
[37] These entities are often persons, but may also be groups, organizations, nation states, web sites, scholarly publications.
It has also been applied to the study of markets, where it has been used to examine the role of trust in exchange relationships and of social mechanisms in setting prices.
[41] Dynamic network analysis examines the shifting structure of relationships among different classes of entities in complex socio-technical systems effects, and reflects social stability and changes such as the emergence of new groups, topics, and leaders.
Examples include people, organizations, topics, resources, tasks, events, locations, and beliefs.
With the recent explosion of publicly available high throughput biological data, the analysis of molecular networks has gained significant interest.
Semantic networks are therefore graphical representations of knowledge and are commonly used in neurolinguistics and natural language processing applications.
Semantic network analysis is also used as a method to analyze large texts and identify the main themes and topics (e.g., of social media posts), to reveal biases (e.g., in news coverage), or even to map an entire research field.
An example may be examining the addresses of suspects and victims, the telephone numbers they have dialed, financial transactions they have partaken in during a given timeframe, and the familial relationships between these subjects as a part of the police investigation.
Link analysis here provides the crucial relationships and associations between objects of different types that are not apparent from isolated pieces of information.
Computer-assisted or fully automatic computer-based link analysis is increasingly employed by banks and insurance agencies in fraud detection, by telecommunication operators in telecommunication network analysis, by medical sector in epidemiology and pharmacology, in law enforcement investigations, by search engines for relevance rating (and conversely by the spammers for spamdexing and by business owners for search engine optimization), and everywhere else where relationships between many objects have to be analyzed.
The formula above describes the "force" of infection for each susceptible unit in an infectious population, where β is equivalent to the transmission rate of said disease.
To track the change of those susceptible in an infectious population: Over time, the number of those infected fluctuates by: the specified rate of recovery, represented by
By randomly jumping to these other nodes, it helps PageRank completely traverse the network as some webpages exist on the periphery and would not as readily be assessed.
In an improvement over the aforementioned formula for determining PageRank includes adding these random jump components.
Another way of looking at it: Information about the relative importance of nodes and edges in a graph can be obtained through centrality measures, widely used in disciplines like sociology.
[47] In conserved spread, the total amount of content that enters a complex network remains constant as it passes through.
The model of conserved spread can best be represented by a pitcher containing a fixed amount of water being poured into a series of funnels connected by tubes.
Finally, it is assumed that the rate of infection and recovery is much faster than the time scale of births and deaths and therefore, these factors are ignored in this model.
[50] Attempts to model real-world systems as multidimensional networks have been used in various fields such as social network analysis,[51] economics, history, urban and international transport, ecology, psychology, medicine, biology, commerce, climatology, physics, computational neuroscience, operations management, and finance.