New York City Subway map
The official map has evolved gradually under the control of the Marketing and Corporate Communications Department of the Metropolitan Transportation Authority (MTA).
[4] In fact, even in 1939, the year before the unification of the IRT, BMT, and Independent Subway System (IND) into one entity,[5] maps by private businesses were still being printed showing only the routes of one company.
By contrast, the Hertz map, which replaced the Vignelli design in 1979, contained elements that were more curved and "organic looking" while clarifying the nuances and complexities of the three former systems.
First: from 1954 onwards, they acquired stocks of subway maps designed by Stephen Voorhies and printed with promotional material for the Union Dime Bank.
He had also spent a year studying under Eric Gill in England and expressed admiration for the London Underground map.
There were three winners; one of them, R. Raleigh D'Adamo, submitted an explanatory report with his map, which detailed his innovative proposal to color-code the subway by individual routes rather than by historic operating company.
This concept was implemented by Dr. Stanley Goldstein of Hofstra University, working as a consultant to the TA, and by Dante Calise, art director at Diamond Packaging, the firm that printed the subway map.
[18] The TA's new map, released in 1967, used Raleigh D'Adamo's principle of color-coding for the first time, but it suffered from what Vignelli called "fragmentation" and was not well received.
While the Unimark signage project was still being finished up with the creation of the New York City Transit Authority Graphics Standards Manual, Vignelli went to Ronan with a mock-up of part of the map for Lower Manhattan.
By this time, the map was almost complete, but was subject to corrections and modifications requested by Raleigh D'Adamo, who was now Head of the Office of Inspection and Review at the MTA.
At the end of 1976, Wilkinson was assigned from Transit to be Executive Officer of Surface operations and stepped down from the Subway Map Committee.
This was exhibited at the Cooper Union in April, when Tauranac debated with Massimo Vignelli in a public battle between the two schools of map-making.
The curves in Siraisi's drawings helped to alleviate a feeling of disorientation that many riders felt when looking at the straight lines of the Vignelli map, as had been observed in Bronzaft's studies.
In 1991, a multilingual version of the map was printed in six languages commonly used by tourists: English, Spanish, French, German, Italian, and Japanese.
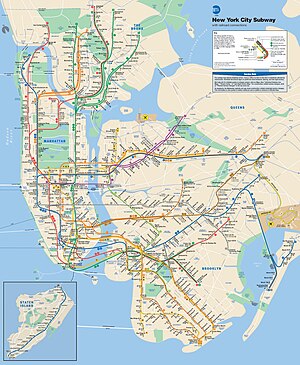
[43] The latest major revision to the official subway map, which took effect on June 27, 2010, makes Manhattan bigger and Staten Island smaller.
For example, since Lower Manhattan and Downtown Brooklyn contain high densities of subway stations, these areas are shown as larger than they actually are.
[49] However, only ten buildings are actually shown on the map: four are in Staten Island, while a fifth is the New York Transit Museum in Brooklyn.
[60] On the real-time map, the MTA uses its existing data feeds to show the locations of trains, depicted by darker bars moving along each respective subway route.
[51] In 2011, the MTA began to look at ways of displaying service disruptions due to weekend engineering works in a visual format.
On September 16, 2011, the MTA introduced a Vignelli Associates interactive subway map, called "The Weekender",[62] to its website.
[63] As the title suggests,[64] it is a way for riders to get information about any planned work, from late Friday night to early Monday morning, that is going on either on a service(s) or station(s) of the subway during the weekend only.
The game was played on February 2, 2014, at MetLife Stadium at the Meadowlands Sports Complex in East Rutherford, New Jersey.
Called the "Regional Transit Diagram", the map was initially produced specifically for Super Bowl XLVIII, and according to the MTA, "shows all inter-connections between the regional transit services, and highlights with a football icon those areas where Super Bowl related events will occur on both sides of the Hudson River.
[79] In September 2015, a map detailing the number of calories burnt walking between adjacent subway stops was developed by Treated.com and featured on the websites of Gothamist[80] and Time Out.
[83] In May 2017, Brooklyn resident Andrew Lynch created a geographically accurate map of the system's tracks, which was featured on Gothamist.
[84] In 2020, the MTA displayed several new map concepts at the 86th Street station on the BMT Fourth Avenue Line following a renovation project.
[97] The MTA reported in October 2021 that it had received positive feedback,[95] prompting the agency to gradually install the four concepts systemwide in the coming months.
[98] Still, after the 1940 unification of the three companies' routes under the umbrella of a Board of Transportation—later the New York City Transit Authority (NYCTA)—the three networks continued to operate separately and were generally referred to by their old names.
To coordinate with the new color scheme in the map, the NYCTA began to roll out new station and car signage based on a design by Vignelli and Robert Noorda of Unimark International, using the route markers derived from those specified in D’Adamo's report.
The biggest innovation in this redevelopment of the map was the introduction of color-coding by subway route, which D’Adamo recommended in his report to replace the outdated three-color scheme.