Numerical experiments can then be performed in these models, yielding the results that can be interpreted in the context of geological process.
[2] Both qualitative and quantitative understanding of a variety of geological processes can be developed via these experiments.
Flow of fluids is simulated using numerical methods, and this shows how groundwater moves, or how motions of the molten outer core yields the geomagnetic field.
[2] In the late 1960s to 1970s, following the development of finite-element methods in solving continuum mechanics problems for civil engineering, numerical methods were adapted for modeling complex geological phenomena,[5][7] for example, folding[8][9] and mantle convection.
[2] Numerical modeling has become an important tool for tackling geological problems,[2] especially for the parts of the Earth that are difficult to observe directly, such as the mantle and core.
[14] In geology, both approaches are commonly used to model fluid flow like mantle convection, where an Eulerian grid is used for computation and Lagrangian markers are used to visualize the motion.
[15] The Eulerian approach considers the changes of the physical quantities, such as mass and velocity, of a fixed location with time.
[16] The Lagrangian approach, on the other hand, considers the change of physical quantities, such as the volume, of fixed elements of matter over time.
Using the Lagrangian approach, it is easier to follow solid objects which have natural boundary to separate them from the surrounding.
This equation is useful when the model involves continuous fluid flow, like the mantle is over geological time scales.
[2] The momentum equation describes how matter moves in response to force applied.
[2] Numerical methods are techniques to approximate the governing equations in the mathematical models.
[22][23] These kinds of basis functions can then be applied to the whole domain and approximate the governing partial differential equations.
[22][23] As a result, the spectral method converges exponentially and is suitable for solving problems involving a high variability in time or space.
[2][24] The equations used are usually based on the conservation or balance of physical quantities, like mass and energy.
[19][31] The main idea of this method is to model the objects as an assemblage of smaller particles,[19] which is similar to building a castle out of sand.
Numerical modeling has been widely applied in different fields of rock mechanics.
[3] Numerical modeling has been used to predict and describe the thermal history of the Earth's crust, which allows geologists to improve their interpretation of thermochronological data.
[43] It solves the following generalized heat transfer equation with advection using finite element method.
[50][51]One of the well-known programs in modeling groundwater flow is MODFLOW, developed by the United States Geological Survey.
It is a free and open-source program that uses the finite difference method as the framework to model groundwater conditions.
The recent development of related programs offers more features, including:[52][53] The rheology (response of materials to stress) of crust and the lithosphere is complex, since a free surface (the land surface) and the plasticity and elasticity of the crustal materials need to be considered.
[54][55] The Fast Lagrangian Analysis of Continua (FLAC) is one of the most popular approaches in modeling crustal dynamics.
[2] Grid refinement, in which the size of the elements is reduced in the part that requires more accurate approximation, is possibly the direction of future development in numerical modeling of mantle convection.
[2][67] Stream functions were used to remove the effect of pressure and reduce the complexity of the algorithm.
[2] Due to the advancement in computer technology, finite differences with higher order terms are now used to generate a more accurate result.
[2][74] Mantle convection modeled by finite volume approach is often based on the balance between pressure and momentum.
[2][90][91][92][93][94][95][96] However, the lateral changes of viscosity of mantle are difficult to manage in this approach, and other methods became more popular in the 2010s.
[106][107][108] However, due to limitations in computation power, in some models, the spacing of the mesh is too large (compared with the wavelength of the seismic waves) so that the results are inaccurate due to grid dispersion, in which the seismic waves with different frequencies separate.
[106][109] Some researchers suggest using the spectral method to model seismic wave propagation.
Simulation of seismic wave propagation in global scale using supercomputer to solve
wave equations
[
1
]
Steps in numerical modeling.
The first step in numerical modeling is to capture the actual geological scenario quantitatively. For example, in mantle convection modeling, heat equations are used to describe the heat energy circulating in the system while
Navier–Stokes equations
describe the flow of viscous fluid (the mantle rock). Second, since these equations are difficult to solve,
discretization
and numerical methods are chosen to make an approximation to the governing equations. Then, algorithms in the computer can calculate the approximated solutions. Finally, interpretation can be made from those solutions. For instance, in mantle convection modeling, the flow of mantle can first be visualized. Then, the relationship between the patterns of flow and the input parameters may be concluded.
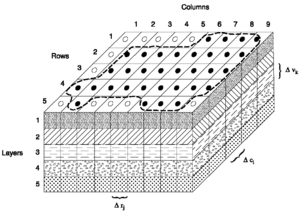
An example of 2D finite element mesh. The domain is subdivided into numerous non-overlapping triangles (elements). Nodes are the
vertices
of the triangles.
Approximating wave equations using the finite element method. The domain is subdivided into numerous triangles. The values of the nodes in the mesh are calculated, showing how a wave propagates in the region.
Solution of
Burgers Equation
, which describes how shock waves behave, using
spectral method
. The domain is first subdivided into rectangular mesh. The idea of this method is similar to the finite element method.
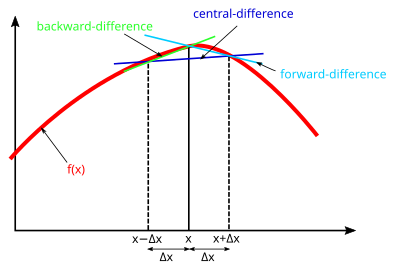
Finite difference method
An example of model using discrete element method, which uses photo of
Peter A. Cundall
to initiate the particles
A cross-section showing the thermal and
exhumation
patterns of the crust generated by the movement of a
fault
. The simulation is generated by
Pecube
[Helsinki University Geodynamics Group (HUGG) version].
[
43
]
[
44
]
[
45
]
The model is three-dimensional;
[
43
]
[
44
]
the figure shows a slice of the model for simplicity. In the figure, the white line indicates the
fault
. The small black arrows indicate the direction of movement of the material at that point. The red lines are isotherm (the point of the line are of same temperature). The Pecube model uses both Eulerian and Lagrangian approaches.
[
43
]
The fault can be regarded as stationary and the crust is moving. Initially, the temperature of the crust depends on the depth. The deeper the depth, the hotter the material. During this event, the motion of crust along the fault moves the material with different temperatures. In the hanging wall (the block above the fault), hotter material from deeper depth moves towards the surface; while the cooler material at shallower depth in the footwall (the block below the fault) moves deeper. The flow of material changes the thermal pattern (the isotherm bends across the fault) of the crust, which may reset the thermochronometers in the rock. On the other hand, the
exhumation
rate also affects the thermochronometers in the rock. A positive rate of exhumation indicates the rock is moving towards the surface, while a negative rate of exhumation indicate the rock is moving downwards. The fault geometry impacts the pattern exhumation rate on the surface.
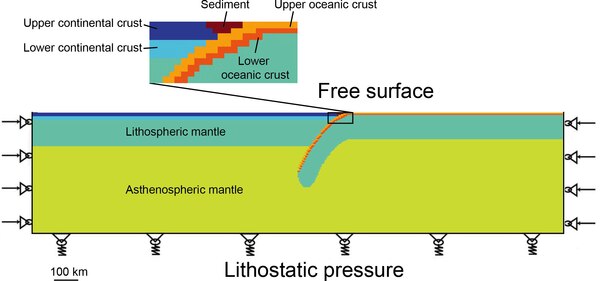
This figure shows the setup of the numerical model used in the study of tectonic evolution of the
Cathaysia Block
,
[
54
]
which makes up the southeast part of the
South China carton
.
[
62
]
This model uses the code called
Flamar
, which is a FLAC-like code that combines finite difference and finite element methods.
[
54
]
The element used in this Lagrangian mesh is quadrilateral.
[
54
]
The boundary conditions applied to the land surface are free, which is affected by erosion and sediment deposition.
[
54
]
The boundary on the sides is at constant velocity, which will push the crust to
subduct
.
[
54
]
The boundary condition used at the bottom is called "Winkler's pliable basement". It is at
hydrostatic equilibrium
and it allows the base to slip freely horizontally.
[
54
]
A simulation of mantle convection in a form of a quarter of 2D annulus using
ASPECT
.
[
63
]
[
64
]
In the model, the temperature of the
core-mantle boundary
(inner boundary) is a constant of 4273 K (about 4000°C), while that at the boundary between crust and mantle (outer boundary) is 973 K (about 700°C).
[
63
]
The mesh in the simulation changes over time. The code uses
adaptive mesh refinement
, the mesh is finer in the areas that need more accurate calculation, such as the rising plumes, while the mesh is coarser in other area to save the computational power.
[
63
]
In the figure, red color indicates a warmer temperature while blue color indicate a cooler temperature; hot material rises from the
core mantle boundary
due to lower density. When the hot material reaches the outer boundary, it starts to move in horizontally and eventually sinks due to cooling.
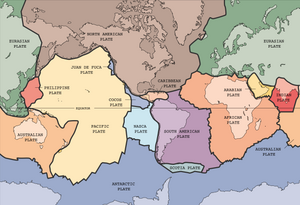
The Earth consists of several plates. Numerical models can be used to model the kinematics of plates.
A numerical geodynamo model (Glatzmaier-Roberts model) showing the magnetic field generated by the flowing liquid outer core.
[
105
]
This figure shows how the magnetic field of the Earth behaves during a
magnetic reversal
.
Simulation of seismic wave propagation through the Earth.
[
1
]