Nyquist stability criterion
Because it only looks at the Nyquist plot of the open loop systems, it can be applied without explicitly computing the poles and zeros of either the closed-loop or open-loop system (although the number of each type of right-half-plane singularities must be known).
In contrast to Bode plots, it can handle transfer functions with right half-plane singularities.
While Nyquist is one of the most general stability tests, it is still restricted to linear time-invariant (LTI) systems.
[5] Additionally, other stability criteria like Lyapunov methods can also be applied for non-linear systems.
Although Nyquist is a graphical technique, it only provides a limited amount of intuition for why a system is stable or unstable, or how to modify an unstable system to be stable.
The most common use of Nyquist plots is for assessing the stability of a system with feedback.
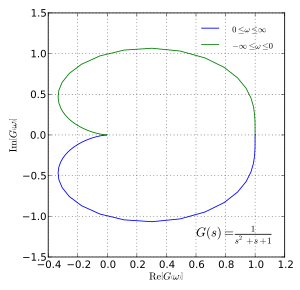
The range of gains over which the system will be stable can be determined by looking at crossings of the real axis.
The Nyquist plot can provide some information about the shape of the transfer function.
For instance, the plot provides information on the difference between the number of zeros and poles of the transfer function[6] by the angle at which the curve approaches the origin.
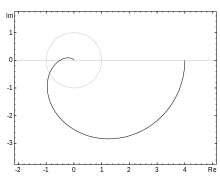
When drawn by hand, a cartoon version of the Nyquist plot is sometimes used, which shows the linearity of the curve, but where coordinates are distorted to show more detail in regions of interest.
When plotted computationally, one needs to be careful to cover all frequencies of interest.
This typically means that the parameter is swept logarithmically, in order to cover a wide range of values.
, the closed loop transfer function (CLTF) then becomes: Stability can be determined by examining the roots of the desensitivity factor polynomial
Conclusions can also be reached by examining the open loop transfer function (OLTF)
is formed by closing a negative unity feedback loop around the open-loop transfer function, then the roots of the characteristic equation are also the zeros of
plane, encompassing but not passing through any number of zeros and poles of a function
Instead of Cauchy's argument principle, the original paper by Harry Nyquist in 1932 uses a less elegant approach.
The approach explained here is similar to the approach used by Leroy MacColl (Fundamental theory of servomechanisms 1945) or by Hendrik Bode (Network analysis and feedback amplifier design 1945), both of whom also worked for Bell Laboratories.
By counting the resulting contour's encirclements of −1, we find the difference between the number of poles and zeros in the right-half complex plane of
is the number of poles of the closed loop system in the right half plane, and
(Using RHP zeros to "cancel out" RHP poles does not remove the instability, but rather ensures that the system will remain unstable even in the presence of feedback, since the closed-loop roots travel between open-loop poles and zeros in the presence of feedback.
In fact, the RHP zero can make the unstable pole unobservable and therefore not stabilizable through feedback.)
This results from the requirement of the argument principle that the contour cannot pass through any pole of the mapping function.
To be able to analyze systems with poles on the imaginary axis, the Nyquist Contour can be modified to avoid passing through the point
Our goal is to, through this process, check for the stability of the transfer function of our unity feedback system with gain k, which is given by That is, we would like to check whether the characteristic equation of the above transfer function, given by has zeros outside the open left-half-plane (commonly initialized as OLHP).
enclosing the right half plane, with indentations as needed to avoid passing through zeros or poles of the function
In fact, we find that the above integral corresponds precisely to the number of times the Nyquist plot encircles the point
It is based on the argument principle and the Nyquist plot of the open-loop transfer function of the system.
It can also handle transfer functions with singularities in the right half-plane, unlike Bode plots.
The Nyquist stability criterion can also be used to find the phase and gain margins of a system, which are important for frequency domain controller design.