Pressure–volume diagram
[citation needed] Watt used the diagram to make radical improvements to steam engine performance.
The diagram enables calculation of the work performed and thus can provide a measure of the power produced by the engine.
[citation needed] In cardiovascular physiology, the diagram is often applied to the left ventricle, and it can be mapped to specific events of the cardiac cycle.
PV loop studies are widely used in basic research and preclinical testing, to characterize the intact heart's performance under various situations (effect of drugs, disease, characterization of mouse strains)[citation needed] The sequence of events occurring in every heart cycle is as follows.
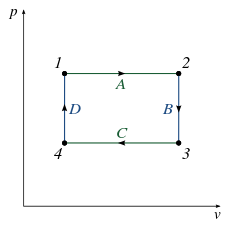
The left figure shows a PV loop from a real experiment; letters refer to points.