Paleoclimatology
Paleoclimatology (British spelling, palaeoclimatology) is the scientific study of climates predating the invention of meteorological instruments, when no direct measurement data were available.
Paleoclimatology uses a variety of proxy methods from Earth and life sciences to obtain data previously preserved within rocks, sediments, boreholes, ice sheets, tree rings, corals, shells, and microfossils.
[2][3] Notions of a changing climate most likely evolved in ancient Egypt, Mesopotamia, the Indus Valley and China, where prolonged periods of droughts and floods were experienced.
[4] The scientific study of paleoclimatology began to take shape in the early 19th century, when discoveries about glaciations and natural changes in Earth's past climate helped to understand the greenhouse effect.
[5] At the end of the 20th century, the empirical research into Earth's ancient climates started to be combined with computer models of increasing complexity.
The techniques used depend on which variable has to be reconstructed (this could be temperature, precipitation, or something else) and how long ago the climate of interest occurred.
For instance, the deep marine record, the source of most isotopic data, exists only on oceanic plates, which are eventually subducted; the oldest remaining material is 200 million years old.
This is due to the millions of years of disruption experienced by the rock formations, such as pressure, tectonic activity, and fluid flowing.
[11] Older intact wood that has escaped decay can extend the time covered by the record by matching the ring depth changes to contemporary specimens.
On a longer time scale, the rock record may show signs of sea level rise and fall, and features such as "fossilised" sand dunes can be identified.
Examples of these conditions for coral include water temperature, freshwater influx, changes in pH, and wave disturbances.
From there, specialized equipment, such as the Advanced Very High Resolution Radiometer (AVHRR) instrument, can be used to derive the sea surface temperature and water salinity from the past few centuries.
In addition, there would probably have been simple hydrides such as those now found in gas giants like Jupiter and Saturn, notably water vapor, methane, and ammonia.
In the late Archaean eon, an oxygen-containing atmosphere began to develop, apparently from photosynthesizing cyanobacteria (see Great Oxygenation Event) which have been found as stromatolite fossils from 2.7 billion years ago.
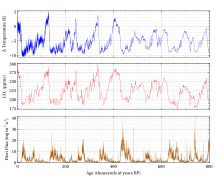
The amount of oxygen in the atmosphere has fluctuated over the last 600 million years, reaching a peak of 35%[23] during the Carboniferous period, significantly higher than today's 21%.
[27] The reconstruction of the Precambrian climate is difficult for various reasons including the low number of reliable indicators and a, generally, not well-preserved or extensive fossil record (especially when compared to the Phanerozoic eon).
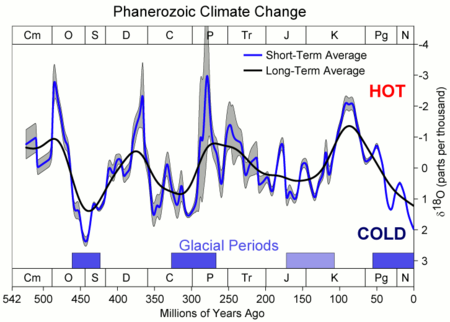
[32] Royer et al. 2004[33] found a climate sensitivity for the rest of the Phanerozoic which was calculated to be similar to today's modern range of values.
[citation needed] One requirement for the development of large scale ice sheets seems to be the arrangement of continental land masses at or near the poles.
However, the presence or absence of land masses at the poles is not sufficient to guarantee glaciations or exclude polar ice caps.
Evidence exists of past warm periods in Earth's climate when polar land masses similar to Antarctica were home to deciduous forests rather than ice sheets.
The relatively warm local minimum between Jurassic and Cretaceous goes along with an increase of subduction and mid-ocean ridge volcanism[34] due to the breakup of the Pangea supercontinent.
Some of the most severe fluctuations, such as the Paleocene-Eocene Thermal Maximum, may be related to rapid climate changes due to sudden collapses of natural methane clathrate reservoirs in the oceans.
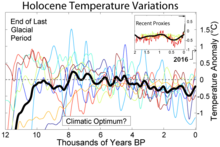
The graph on the left shows the temperature change over the past 12,000 years, from various sources; the thick black curve is an average.
Climate forcing is the difference between radiant energy (sunlight) received by the Earth and the outgoing longwave radiation back to space.
Such radiative forcing is quantified based on the CO2 amount in the tropopause, in units of watts per square meter to the Earth's surface.
Analyzing the sum of these forcings contributes to the ability of scientists to make broad conclusive estimates on the Earth’s climate system.
These estimates include the evidence for systems such as long term climate variability (eccentricity, obliquity precession), feedback mechanisms (Ice-Albedo Effect), and anthropogenic influence.
[44] Examples: On timescales of millions of years, the uplift of mountain ranges and subsequent weathering processes of rocks and soils and the subduction of tectonic plates, are an important part of the carbon cycle.
[50] Ice sheet dynamics and continental positions (and linked vegetation changes) have been important factors in the long term evolution of the Earth's climate.